Galaxy interaction induced star formation at different redshifts
Context: starburst galaxies
Galaxies form their stars with a pretty similar fashion. This is seen on an empirical diagram, called the Schmidt-Kennicut diagram (Schmidt 1958, Kennicut 1998) presented in Fig.1. It shows the relation between the gas surface density and the star formation rate surface density. Galaxies with a higher gas surface density will obviously form stars at a higher rate, but we see that they do so along a well defined sequence.
Isolated galaxies lies on the Sequence of Disks. However some galaxies are seen above this sequence, which means that they are forming stars at a much faster rate than expected from their gas distribution.
In the local Universe, detailled observations of these starbursting galaxies showed that they are all undergoing an interaction with another similar galaxy. We can see an exemple of such systems in Fig.2. These interactions will eventually lead to a merging of the two galaxies into a single system, the merger remnant.
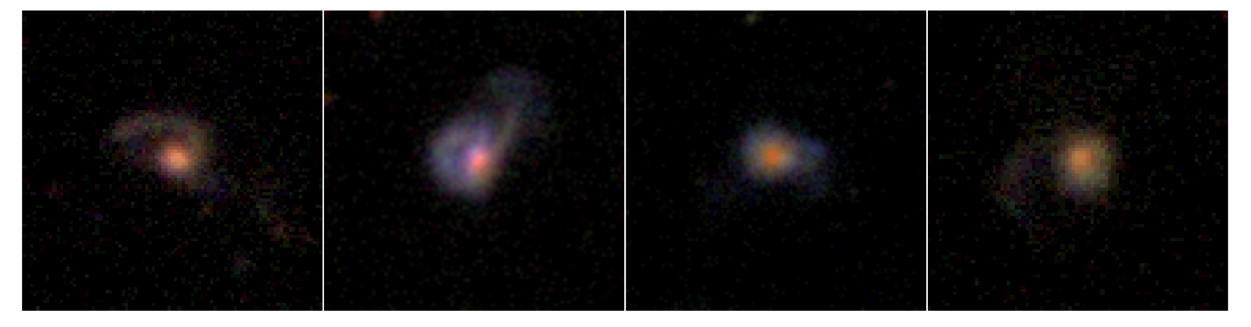
Fig.2: Starburst galaxies from Guo et al. (2016). They all show strong star formation in their bright nucleus, and signs of a recent interaction in their outskirts.
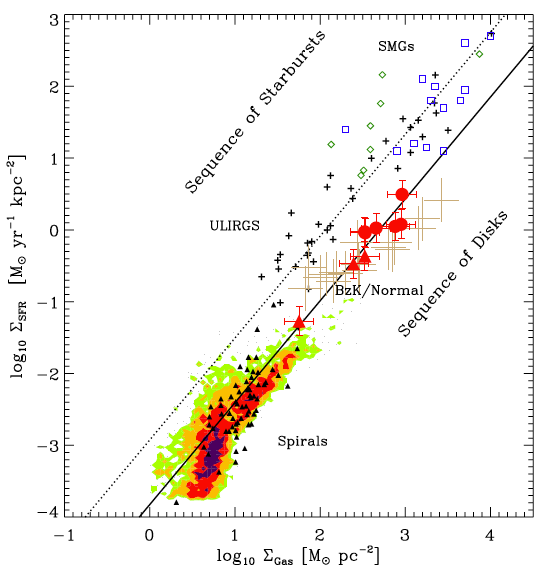
Fig.1: Schmidt-Kennicut relation. We see the double sequence between regular star formation for disks and normal galaxies and a starbursting mode of star formation for ULIRGS (Ultra Luminous InfraRed Galaxies) and SMGs (Sub-Millimeter Galaxies).(Fig.2 from Daddi et al., 2010.)
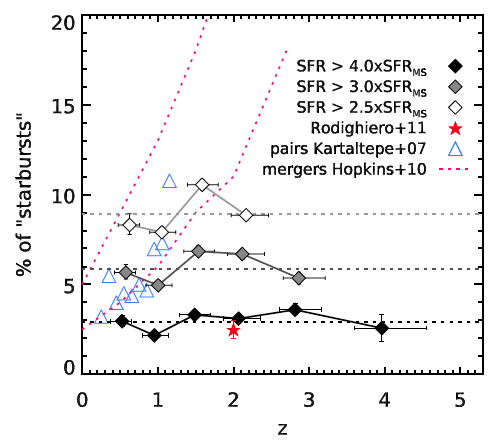
Fig.3: We see that the fraction of galaxies involved in a merger or in a pair increases with redshift, while the fraction of starbursting galaxies stays fairly constant. Fig.18 from Schreiber et al. (2015).
Accurate measurements of the star formation rate (SFR) of galaxies up to very high-redshift have shown that the fraction of galaxies in the starbursting mode of star formation stays very close to 2%, with no clear trend with redshfit. However, both observations and cosmological simulations show that the fraction of galaxies undergoing a starburst per unit time increases with redshift. This observational fact is well summed up in Fig.3.
Therefore, mergers and interactions look much less efficient to trigger this starburting mode of star formation at high redshift...
The principle difference between low and high-redshift massive and star forming galactic disks is the importance of their gas component with respect to their total mass, which can amount to 60% while it is only around 10% for local galaxy. It results in a highly turbulent disk with a clumpy morphology. Several example of these galaxies are presented in Fig.4.
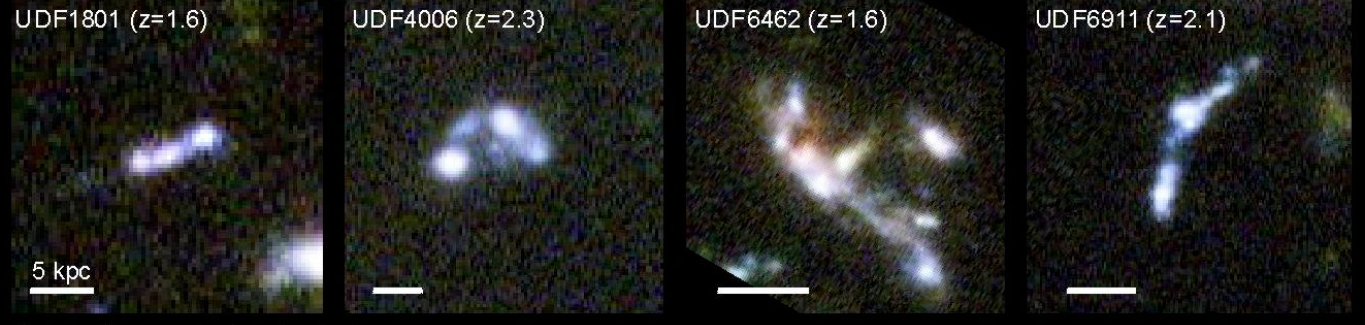
Fig.4: High-redshift galaxies from Elmegreen & Elmegreen (2006). They all present a very disturbed morphology.
Our work
Our working hypothesis is that this lower starburst efficiency at high-redshift is mainly caused by the much higher gas fraction. To test this idea, we ran numerical simulations of galactic disk interactions which differ only in their gas fraction, using the AMR code RAMSES.
In Fig.5 we can see the gas distribution of our two models of galaxies. We see that the gas-poor galaxy forms well defined gaseous spiral arms while the gas-rich shows massive clumps. We then make these disks interact on the same type of orbit and study the gas distribution and the star formation rate in both cases.
The simulations show that the star formation rate of the low gas fraction galaxy is strongly enhanced during the interaction, as is expected from observations of local merging systems. However, the star formation rate of the gas-rich case is only weakly enhanced by the interaction.
The analysis shows that the physical mechanisms responsible for the starbursting mode of star formation in local galaxies are indeed less triggered by the interaction when the gas fraction is high.
The results are presented in Fensch et al., 2016 (MNRAS, in press, arXiv:1610.03877), and summarized here soon.
Fig.5: Gas density maps of our two models of galaxy. The left and right panels show disks and galaxy interactions with a gas fraction of respectively 10% and 60%.
References:
- Daddi et al., 2010, ApJL, 714, 118
- Elmegreen & Elmegreen, 2006, ApJ, 651, 676
- Kennicutt, 1998, ApJ, 498, 541
- Schmidt, 1959, ApJ, 129, 243
- Schreiber et al., 2015, A&A, 575A, 74