Download SeisTomoPy (Durand et al., 2018)
We provide SeisTomoPy, a Python class and a GUI interface, in order to facilitate the visualization and comparison of tomographic models. It can be downloaded here:
https://github.com/stephaniedurand/SeisTomoPy_V3
If used in a scientific work, please refer to:
S. Durand, R. Abreu, C. Thomas (2018) SeisTomoPy: Fast Visualization, Comparison, and Calculations in Global Tomographic Models, Seis. Res. Lett. 89 (2A), 658-667
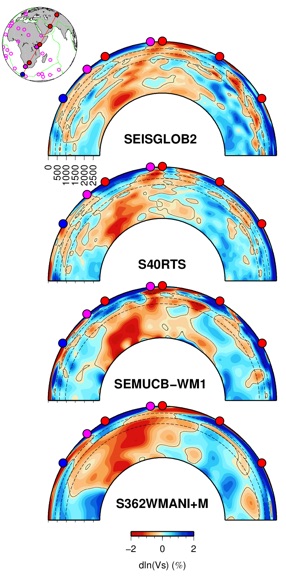
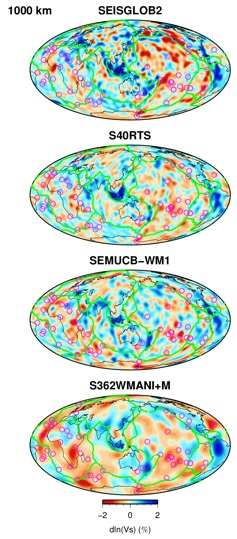
Download our tomographic model SEISGLOB2 (Durand et al., 2017)
We provide a package (SEISGLOB2_plot_package.zip) to make maps and cross-sections in SEISGLOB2 and three other tomographic models (see examples of plots below). Let me know if there is any bug.
If used in a scientific work, please refer to:
S. Durand, E. Debayle, Y. Ricard, C. Zaroli, S. Lambotte (2017) Confirmation of a change in the global shear velocity pattern at around 1000 km depth, Geophys. J. Int. 211 (3), 1628-1639
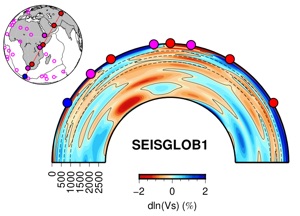
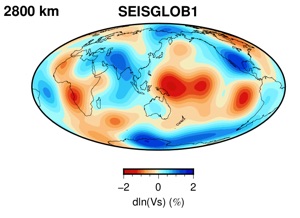
Download our tomographic model SEISGLOB1 (Durand et al., 2016)
We provide a package (SEISGLOB1_plot_package.zip) to make maps and cross-sections in SEISGLOB1 (see examples of plots below). Let me know if there is any bug.
If used in a scientific work, please refer to:
S. Durand, E. Debayle, Y. Ricard, S. Lambotte (2016) Seismic evidence for a change in the large-scale tomographic pattern across the D′′ layer, Geophys. Res. Lett. 43 (15), 7928–7936
Download our Rayleigh phase velocity and error maps (Durand et al., 2015)
You can download .zip files below:
-
-raw_data.zip: It contains *.png files that contains figures of the kernels, phase velocity maps, error maps and ray density maps at each period. The names are of this form drray.yxxx-YXXX where again (Y,y) refer to the mode and (XXX,xxx) to the period. It also contains a directory phase_velocity_maps with the *.xyz files used to make the maps (vs.YXXX.xyz ) and error_maps with the *.xyz files used to make the error maps (dvs.YXXX.xyz )
-
-crust_corrected_data.zip: Idem as before but containing the crust corrected data files.
If used in a scientific work, please refer to:
S. Durand, E. Debayle, Y. Ricard (2015) Rayleigh wave phase velocity and error maps up to the fifth overtone, Geophys. Res. Lett. 42 (9), 3266-3272
Download our Rayleigh surface wave dataset (Durand et al., (2015))
You can download .zip files below:
-
-without_crust_corrections.zip which contains the best raw phase velocity measurements,
-
-with_crust_corrections.zip which contains the best phase velocity measurements that have been corrected from the crust using the crustal model 3SMAC (Nataf & Ricard, 1996)
In both cases, we measured 60 modes and for each mode there is a intomodeT.gem.YXXX (Y indicates the mode and XXX the period) file that contains the phase velocity measurements.
Each intomodeT.gem.YXXX file is built as follows:
z01 3.920000 1996.252.11.07.18.0000.GG.SCZZ....LHZ
51.6300 -176.5600 36.5980 -121.4030
4.0225
0.0014
zU dg name
elat elon slat slon
phase velocity (km/s)
uncertainties
...
where zU is the path number, dg the degree of freedom, name the name of the record, (elat,elon) the epicenter coordinates, (slat,slon) the station coordinates.
If used in a scientific work, please refer to:
S. Durand, E. Debayle, Y. Ricard (2015) Rayleigh wave phase velocity and error maps up to the fifth overtone, Geophys. Res. Lett. 42 (9), 3266-3272