
Address
2 rue Raphaël Dubois
69100 Villeurbanne
France

stephanie.durand@ens-lyon.fr
stephanie.durand@cnrs.fr
stephanie.durand@univ-lyon1.fr
Download SeisTomoPy or use it online
We provide SeisTomoPy, a Python class and a GUI interface, in order to facilitate the visualization and comparison of tomographic models. It can be downloaded here: github.com/stephaniedurand/SeisTomoPy_V3 or used online here: fascil.univ-lyon1.fr
If used in a scientific work, please refer to:
S. Durand, R. Abreu, C. Thomas (2018) SeisTomoPy: Fast Visualization, Comparison, and Calculations in Global Tomographic Models, Seis. Res. Lett. 89 (2A), 658-667

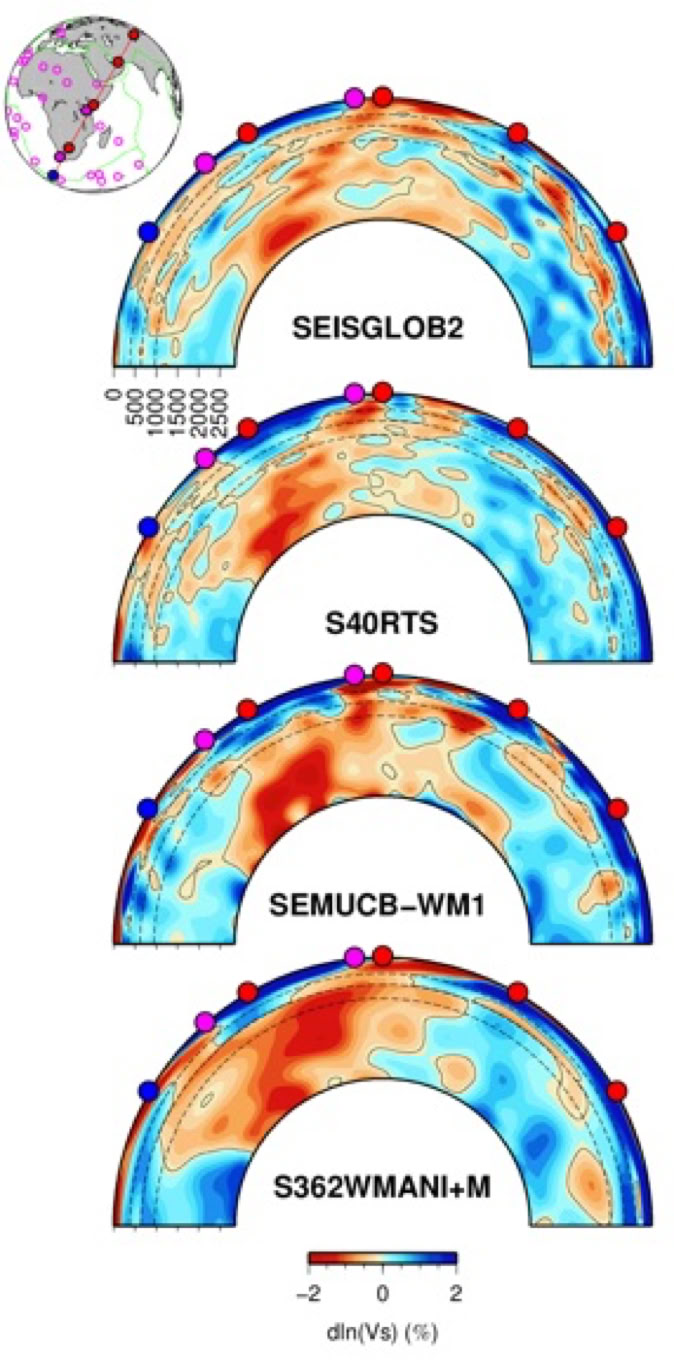
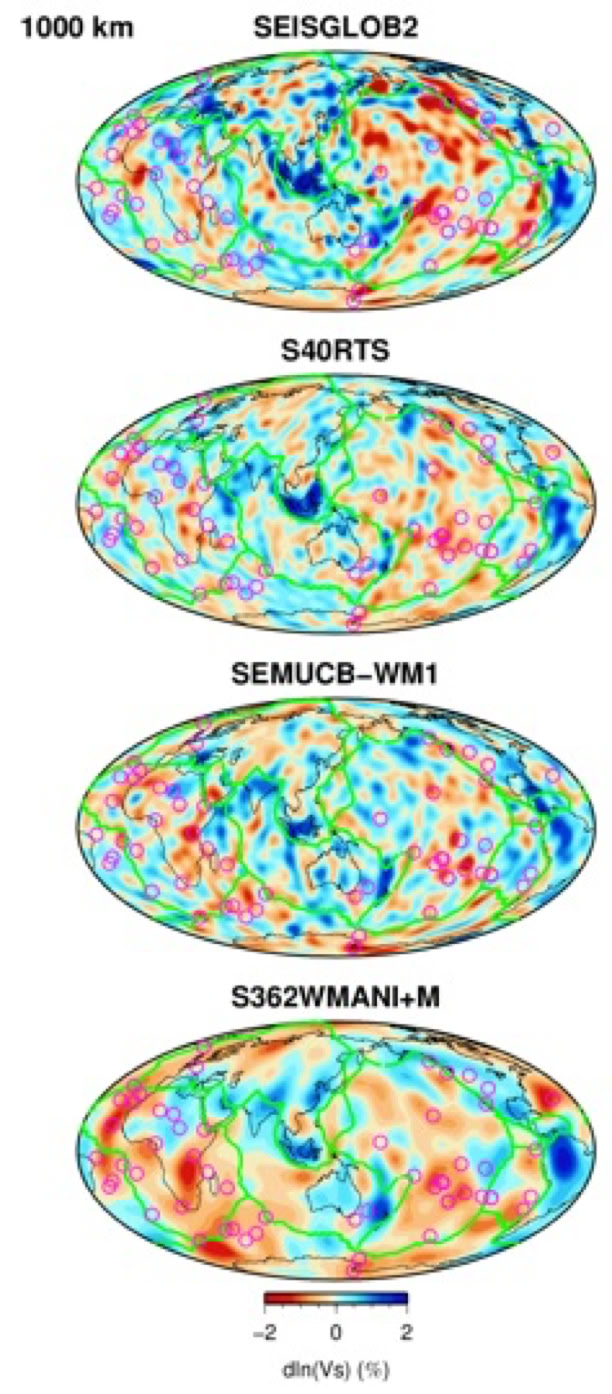
Download our tomographic model SEISGLOB2
We provide a package (SEISGLOB2_plot_package.zip) to make maps and cross-sections in SEISGLOB2 and three other tomographic models (see examples of plots below). Let me know if there is any bug.
If used in a scientific work, please refer to:
S. Durand, E. Debayle, Y. Ricard, C. Zaroli, S. Lambotte (2017) Confirmation of a change in the global shear velocity pattern at around 1000 km depth, Geophys. J. Int. 211 (3), 1628-1639
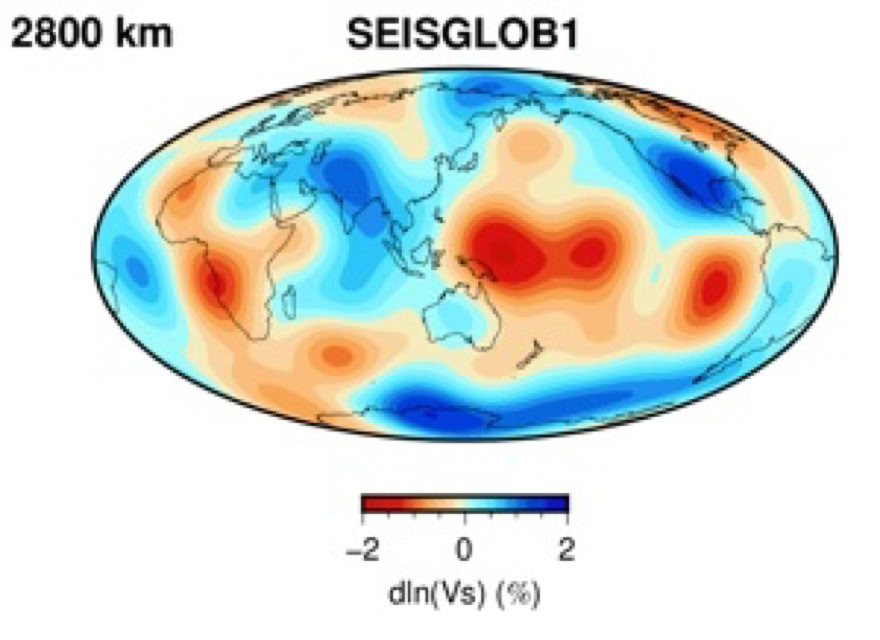
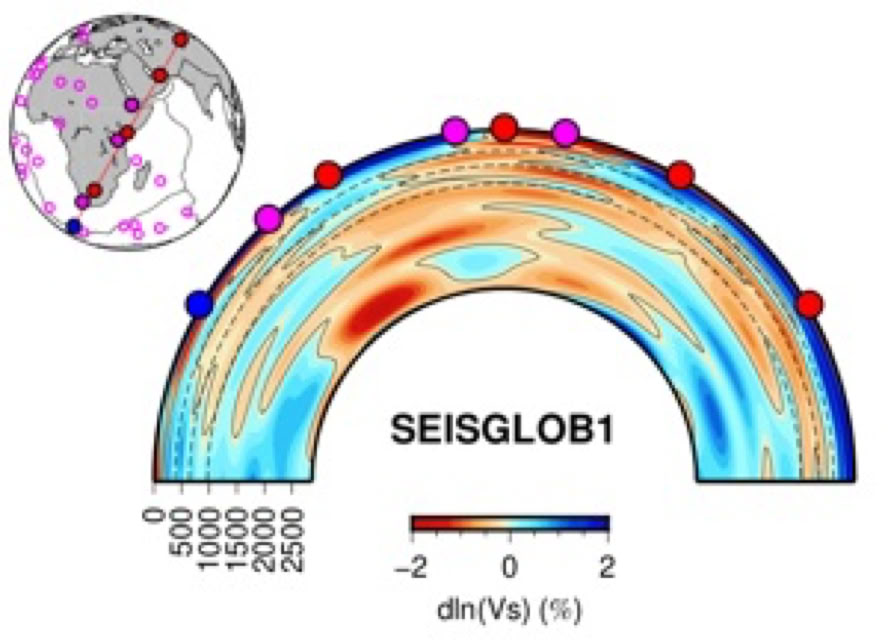
Download our tomographic model SEISGLOB1
We provide a package (SEISGLOB1_plot_package.zip) to make maps and cross-sections in SEISGLOB1 (see examples of plots below). Let me know if there is any bug.
If used in a scientific work, please refer to:
S. Durand, E. Debayle, Y. Ricard, S. Lambotte (2016) Seismic evidence for a change in the large-scale tomographic pattern across the D′′ layer, Geophys. Res. Lett. 43 (15), 7928–7936
Download our Rayleigh phase velocity and error maps
You can download .zip files below:
-raw_data.zip: It contains *.png files that contains figures of the kernels, phase velocity maps, error maps and ray density maps at each period. The names are of this form drray.yxxx-YXXX where again (Y,y) refer to the mode and (XXX,xxx) to the period. It also contains a directory phase_velocity_maps with the *.xyz files used to make the maps (vs.YXXX.xyz ) and error_maps with the *.xyz files used to make the error maps (dvs.YXXX.xyz )
-crust_corrected_data.zip: Idem as before but containing the crust corrected data files.
If used in a scientific work, please refer to:
S. Durand, E. Debayle, Y. Ricard (2015) Rayleigh wave phase velocity and error maps up to the fifth overtone, Geophys. Res. Lett. 42 (9), 3266-3272
Download our Rayleigh surface wave dataset
You can download .zip files below:
-without_crust_corrections.zip which contains the best raw phase velocity measurements,
-with_crust_corrections.zip which contains the best phase velocity measurements that have been corrected from the crust using the crustal model 3SMAC (Nataf & Ricard, 1996)
In both cases, we measured 60 modes and for each mode there is a intomodeT.gem.YXXX (Y indicates the mode and XXX the period) file that contains the phase velocity measurements.
Each intomodeT.gem.YXXX file is built as follows:
z01 3.920000 1996.252.11.07.18.0000.GG.SCZZ....LHZ
51.6300 -176.5600 36.5980 -121.4030
4.0225
0.0014
zU dg name
elat elon slat slon
phase velocity (km/s)
uncertainties
...
where zU is the path number, dg the degree of freedom, name the name of the record, (elat,elon) the epicenter coordinates, (slat,slon) the station coordinates.
If used in a scientific work, please refer to:
S. Durand, E. Debayle, Y. Ricard (2015) Rayleigh wave phase velocity and error maps up to the fifth overtone, Geophys. Res. Lett. 42 (9), 3266-3272