Here are some simulations of random planar maps that I made. Click on the pictures to obtain a better resolution. All the maps have been sampled in language C by using edge-flips (see the introduction of this paper for more details).
Circle packings
The following pictures represent (a part of) the circle packing of a uniform triangulation of a 150-gon with 3000 internal vertices. These pictures have been made with the help of the software CirclePack by Ken Stephenson. For example, here is the .p file corresponding to the first one. To visualize it in CirclePack, open it, enter the command max_pack;Disp -cf; and then, if needed, enter repack;fix;disp -wr; until the circles are well placed.
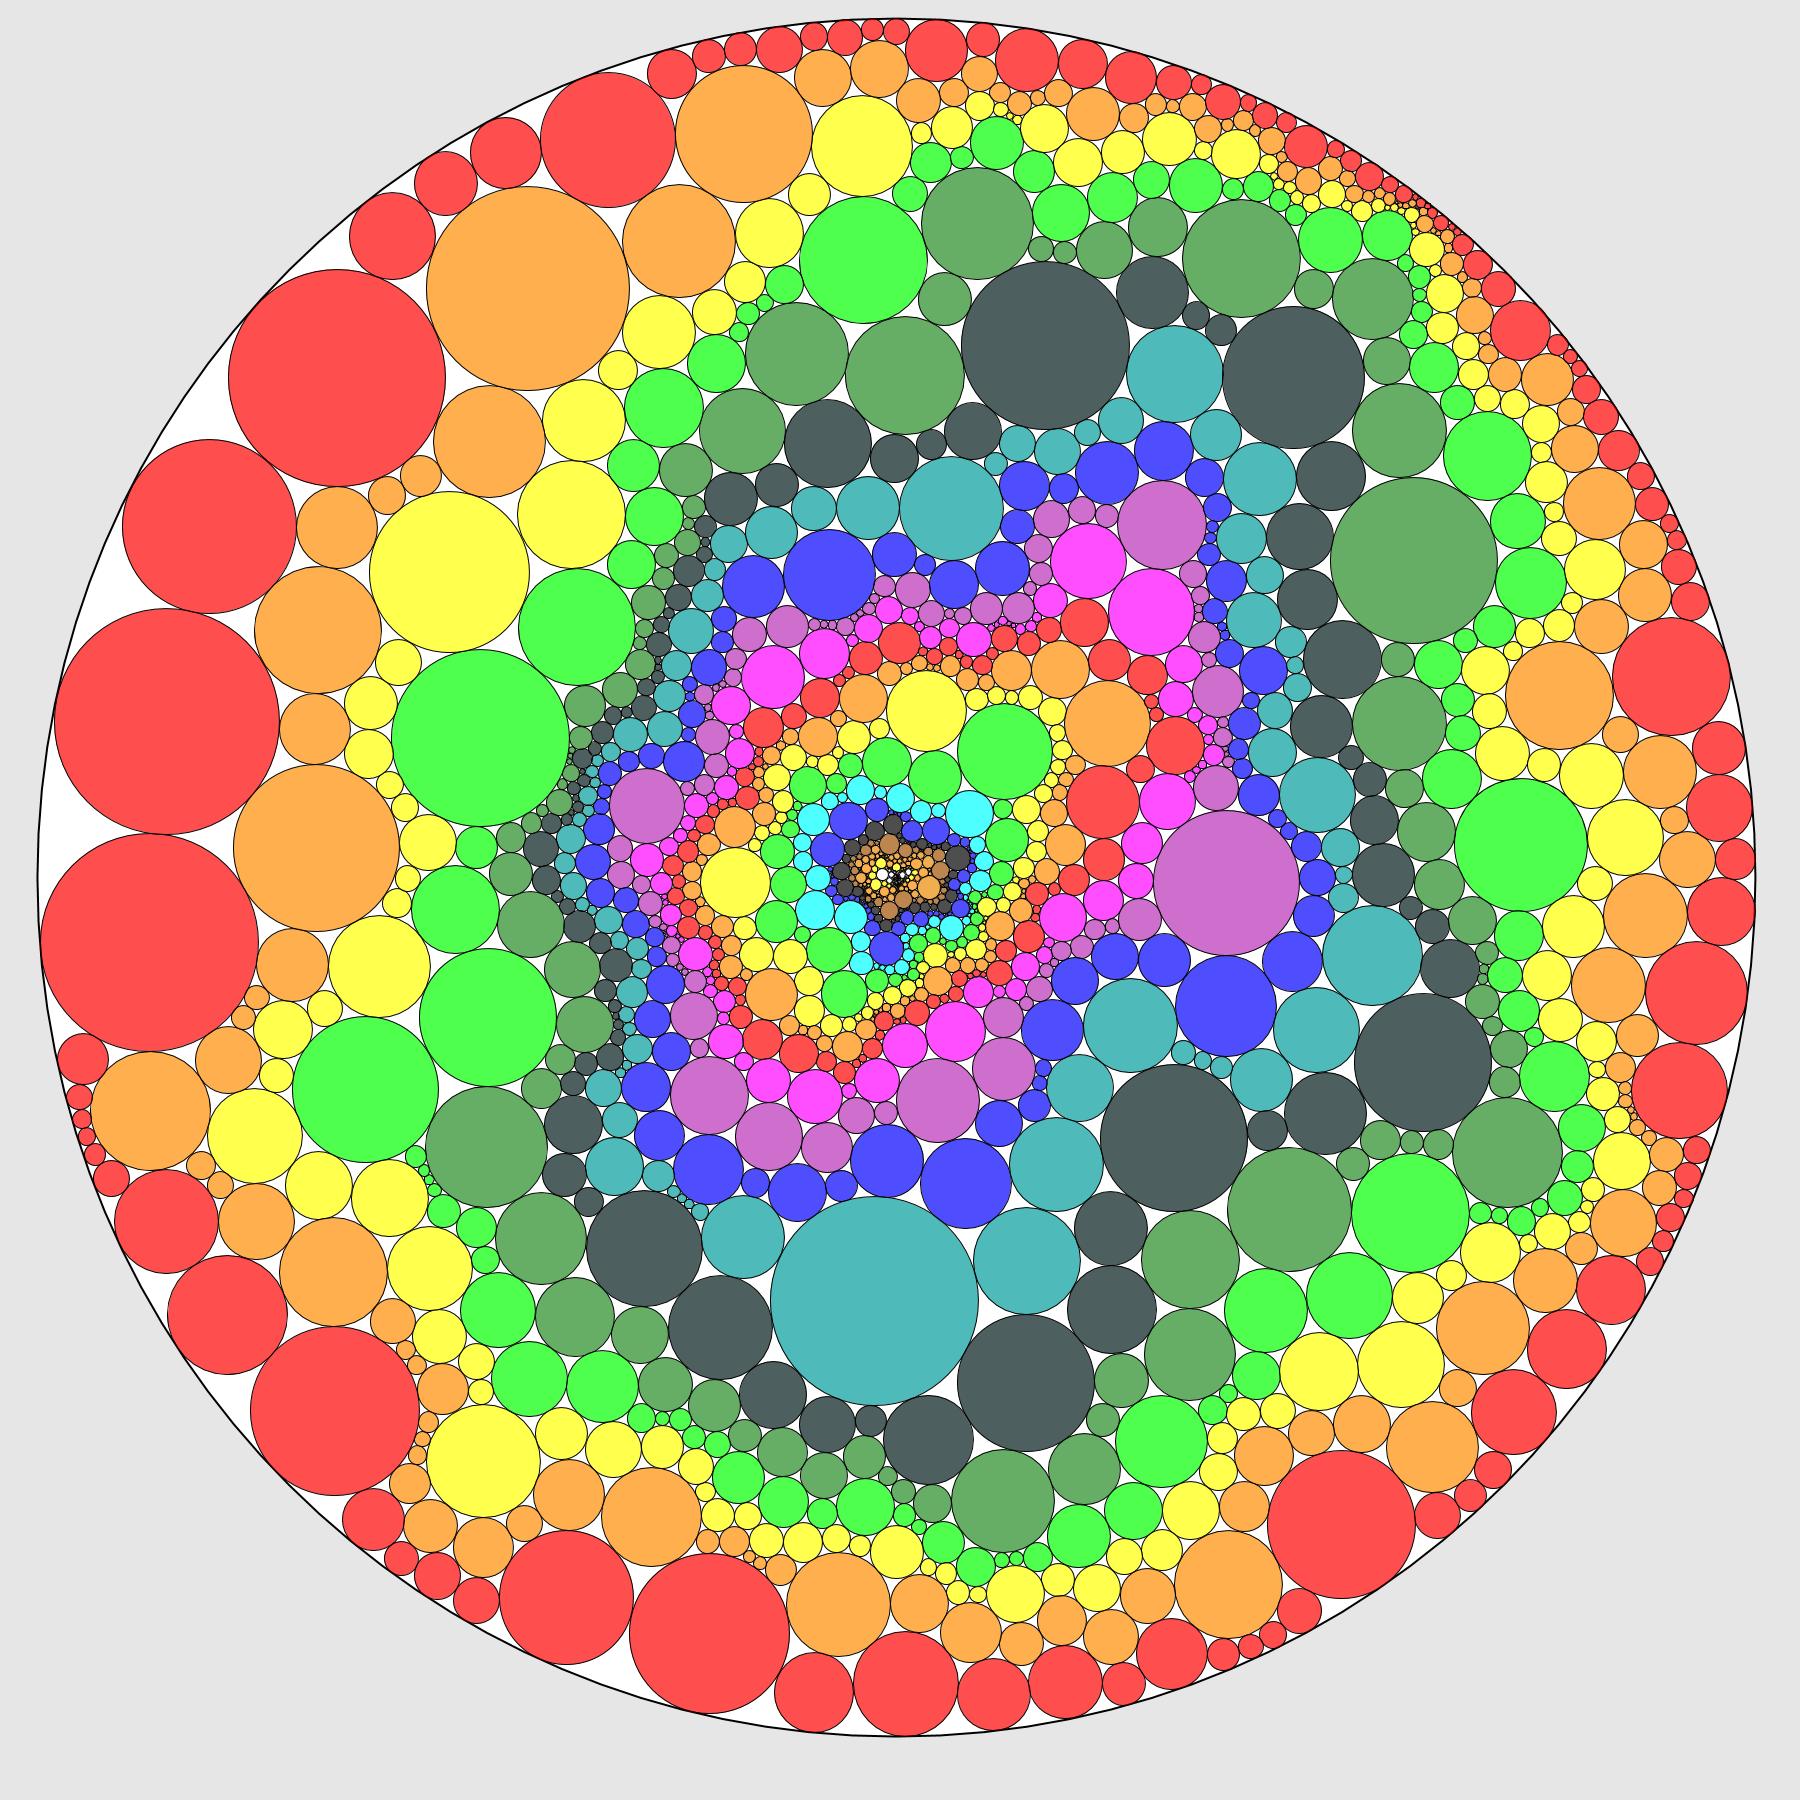
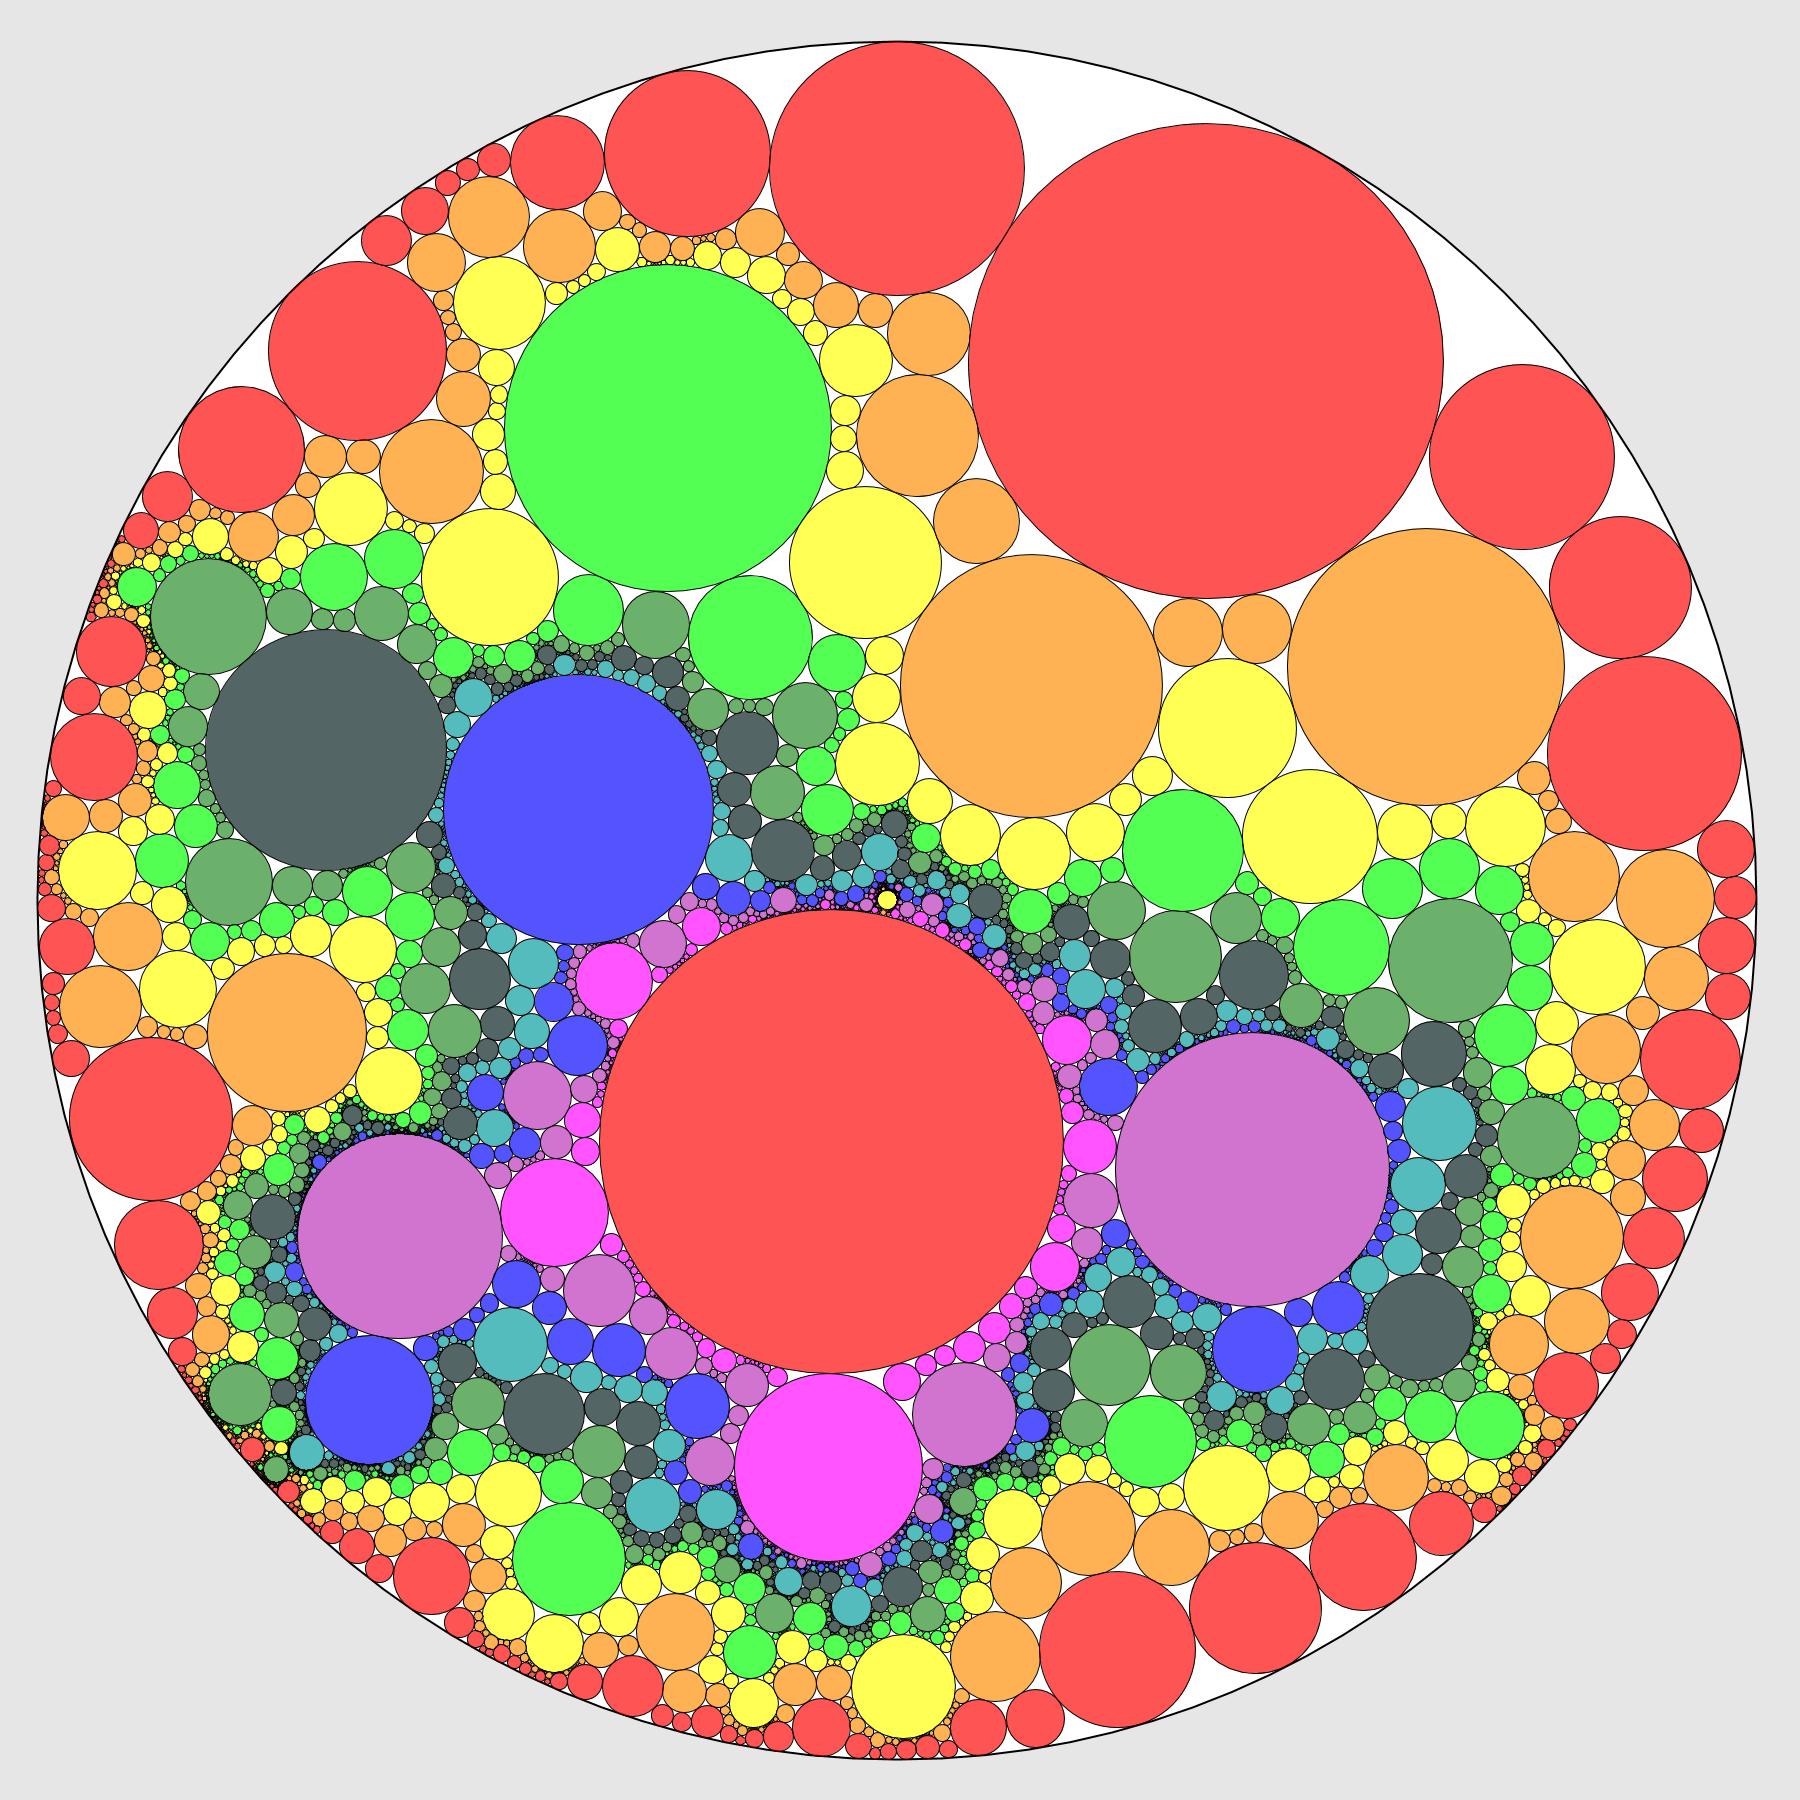
Graph distances
On the left, the colours correspond to the graph distances to the boundary. On the right, they correspond to the distances to a fixed root point in the center.
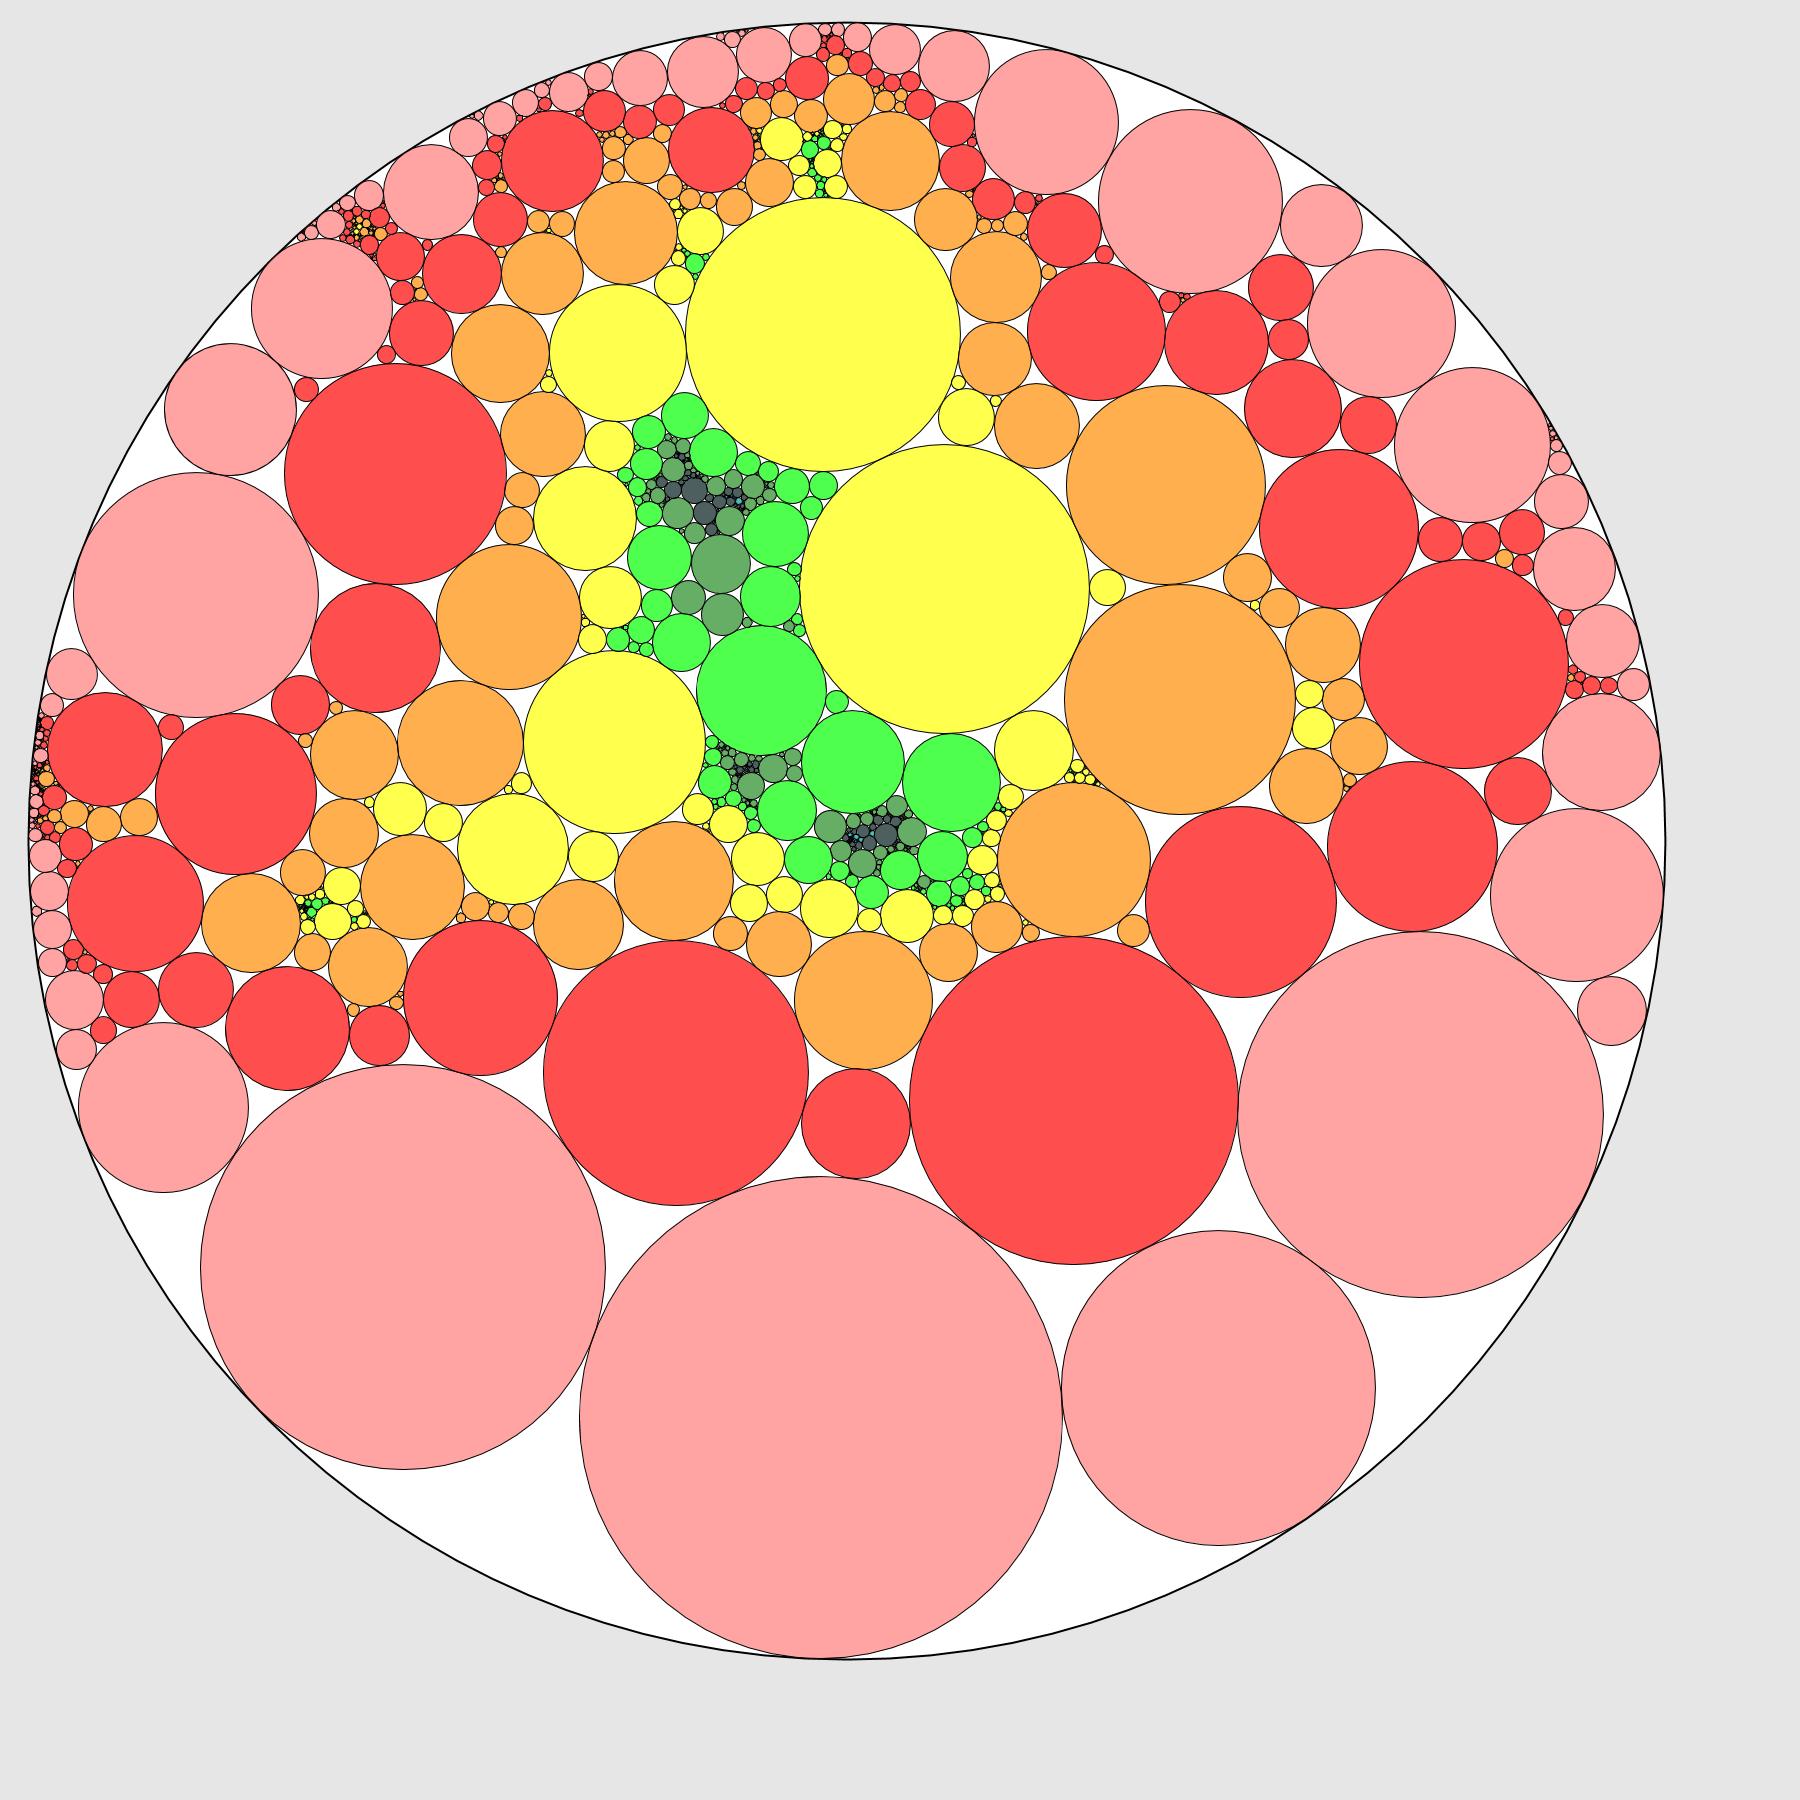
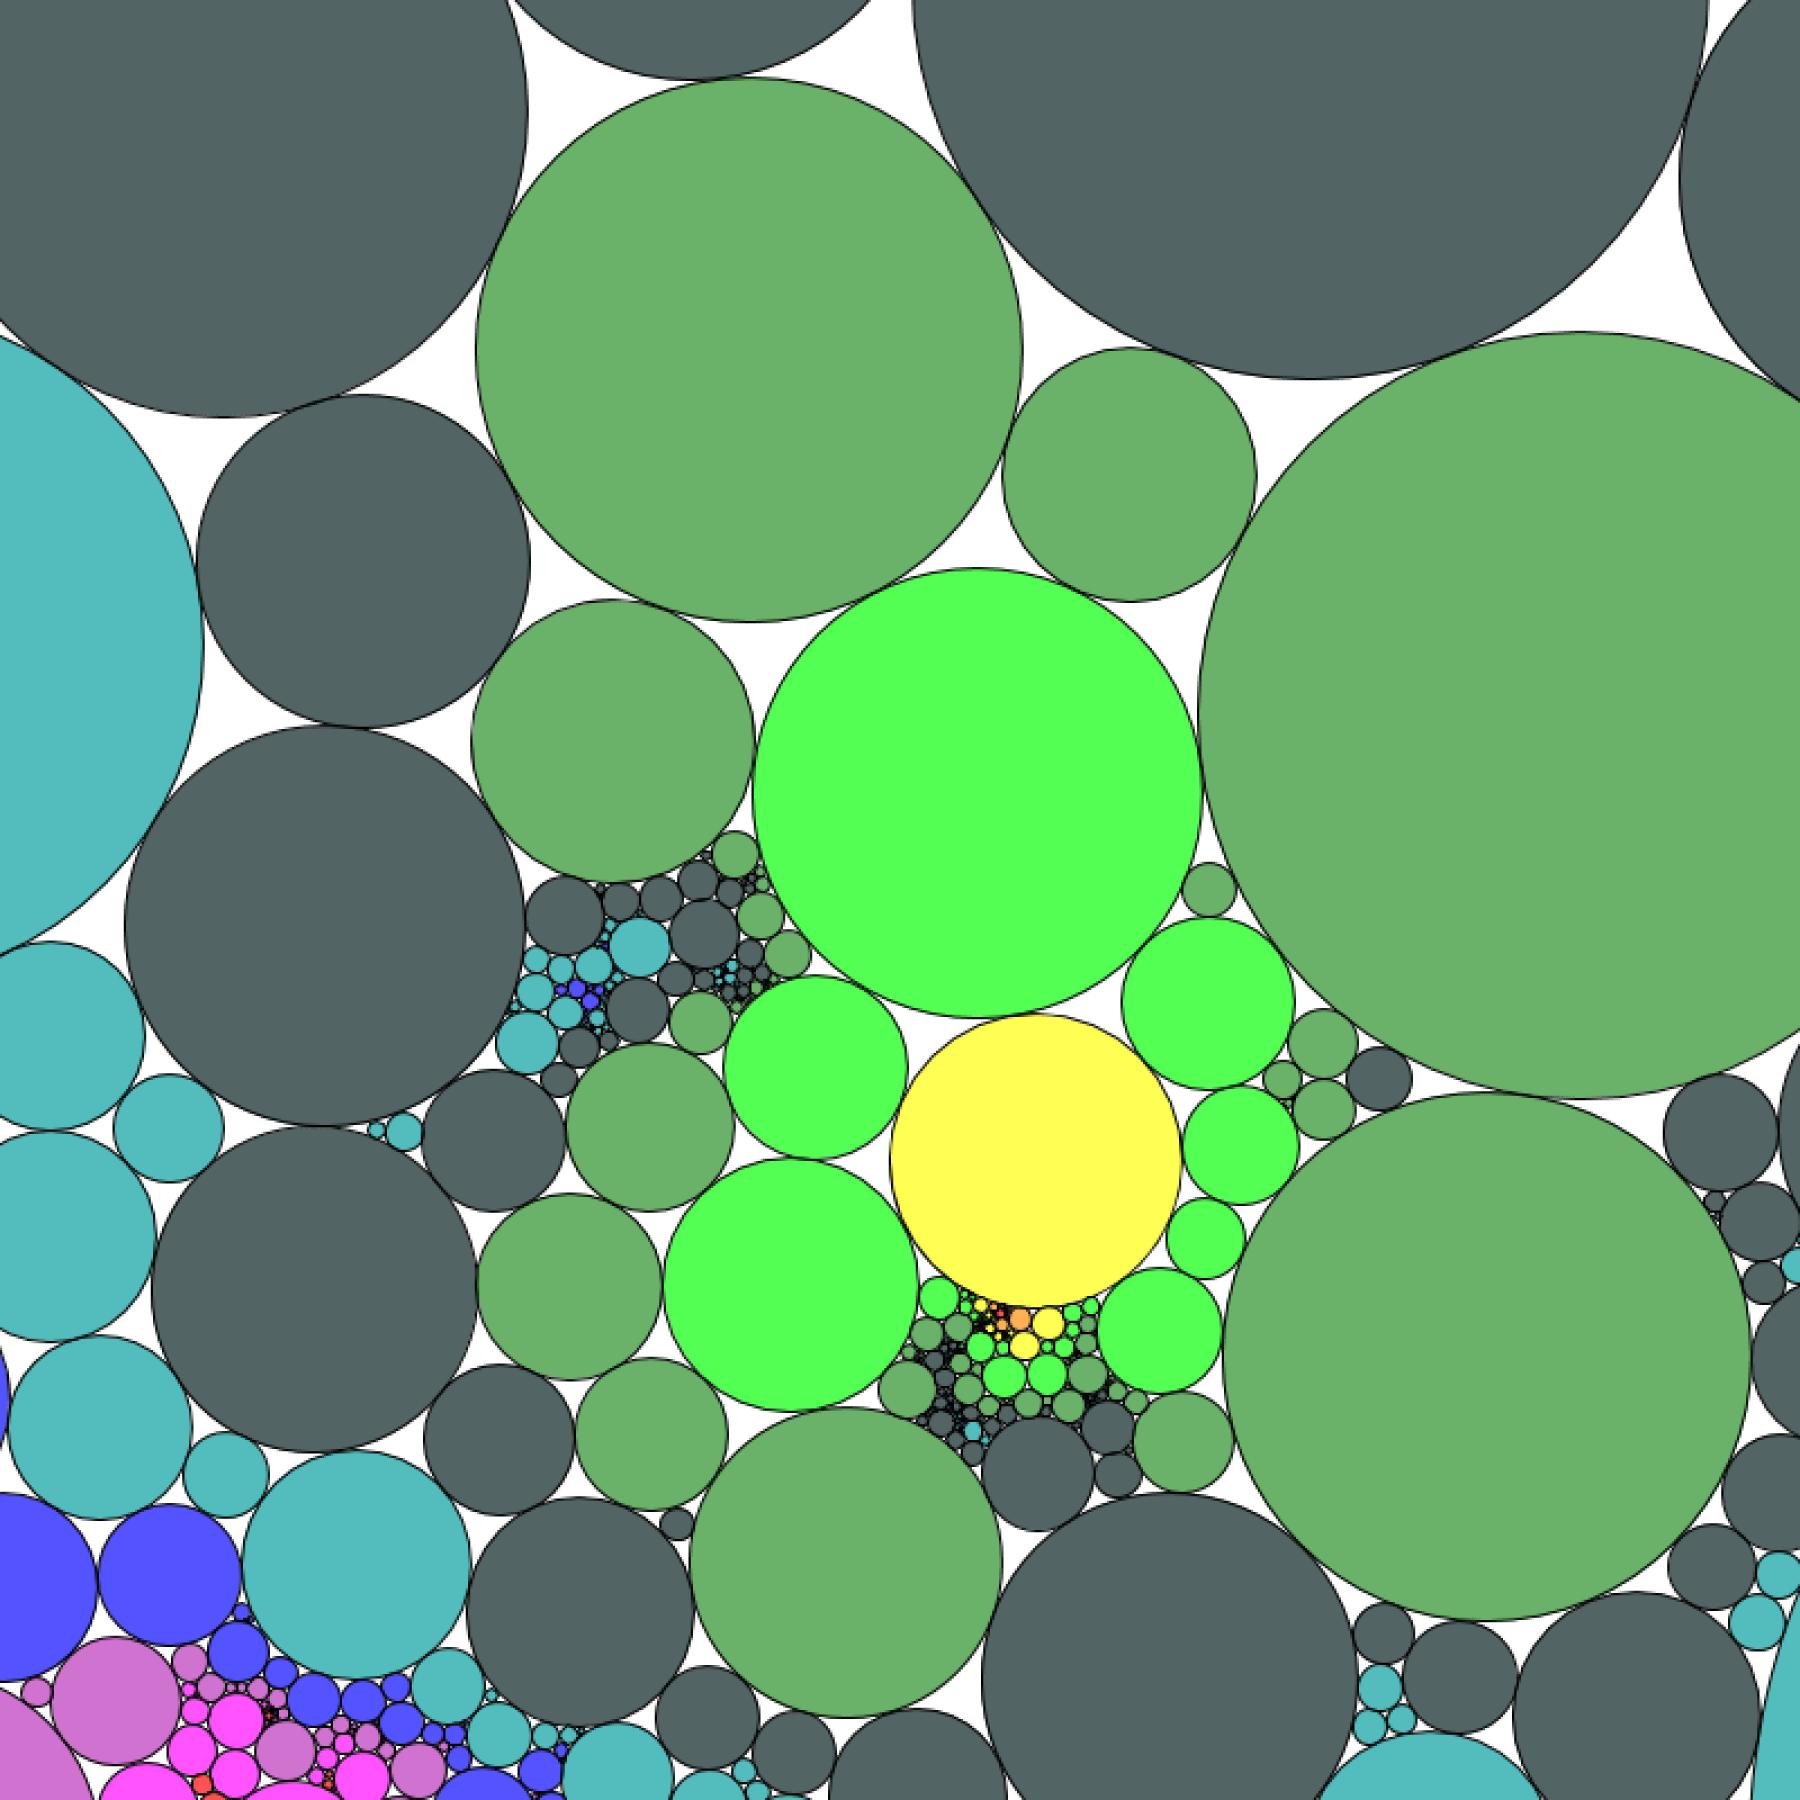
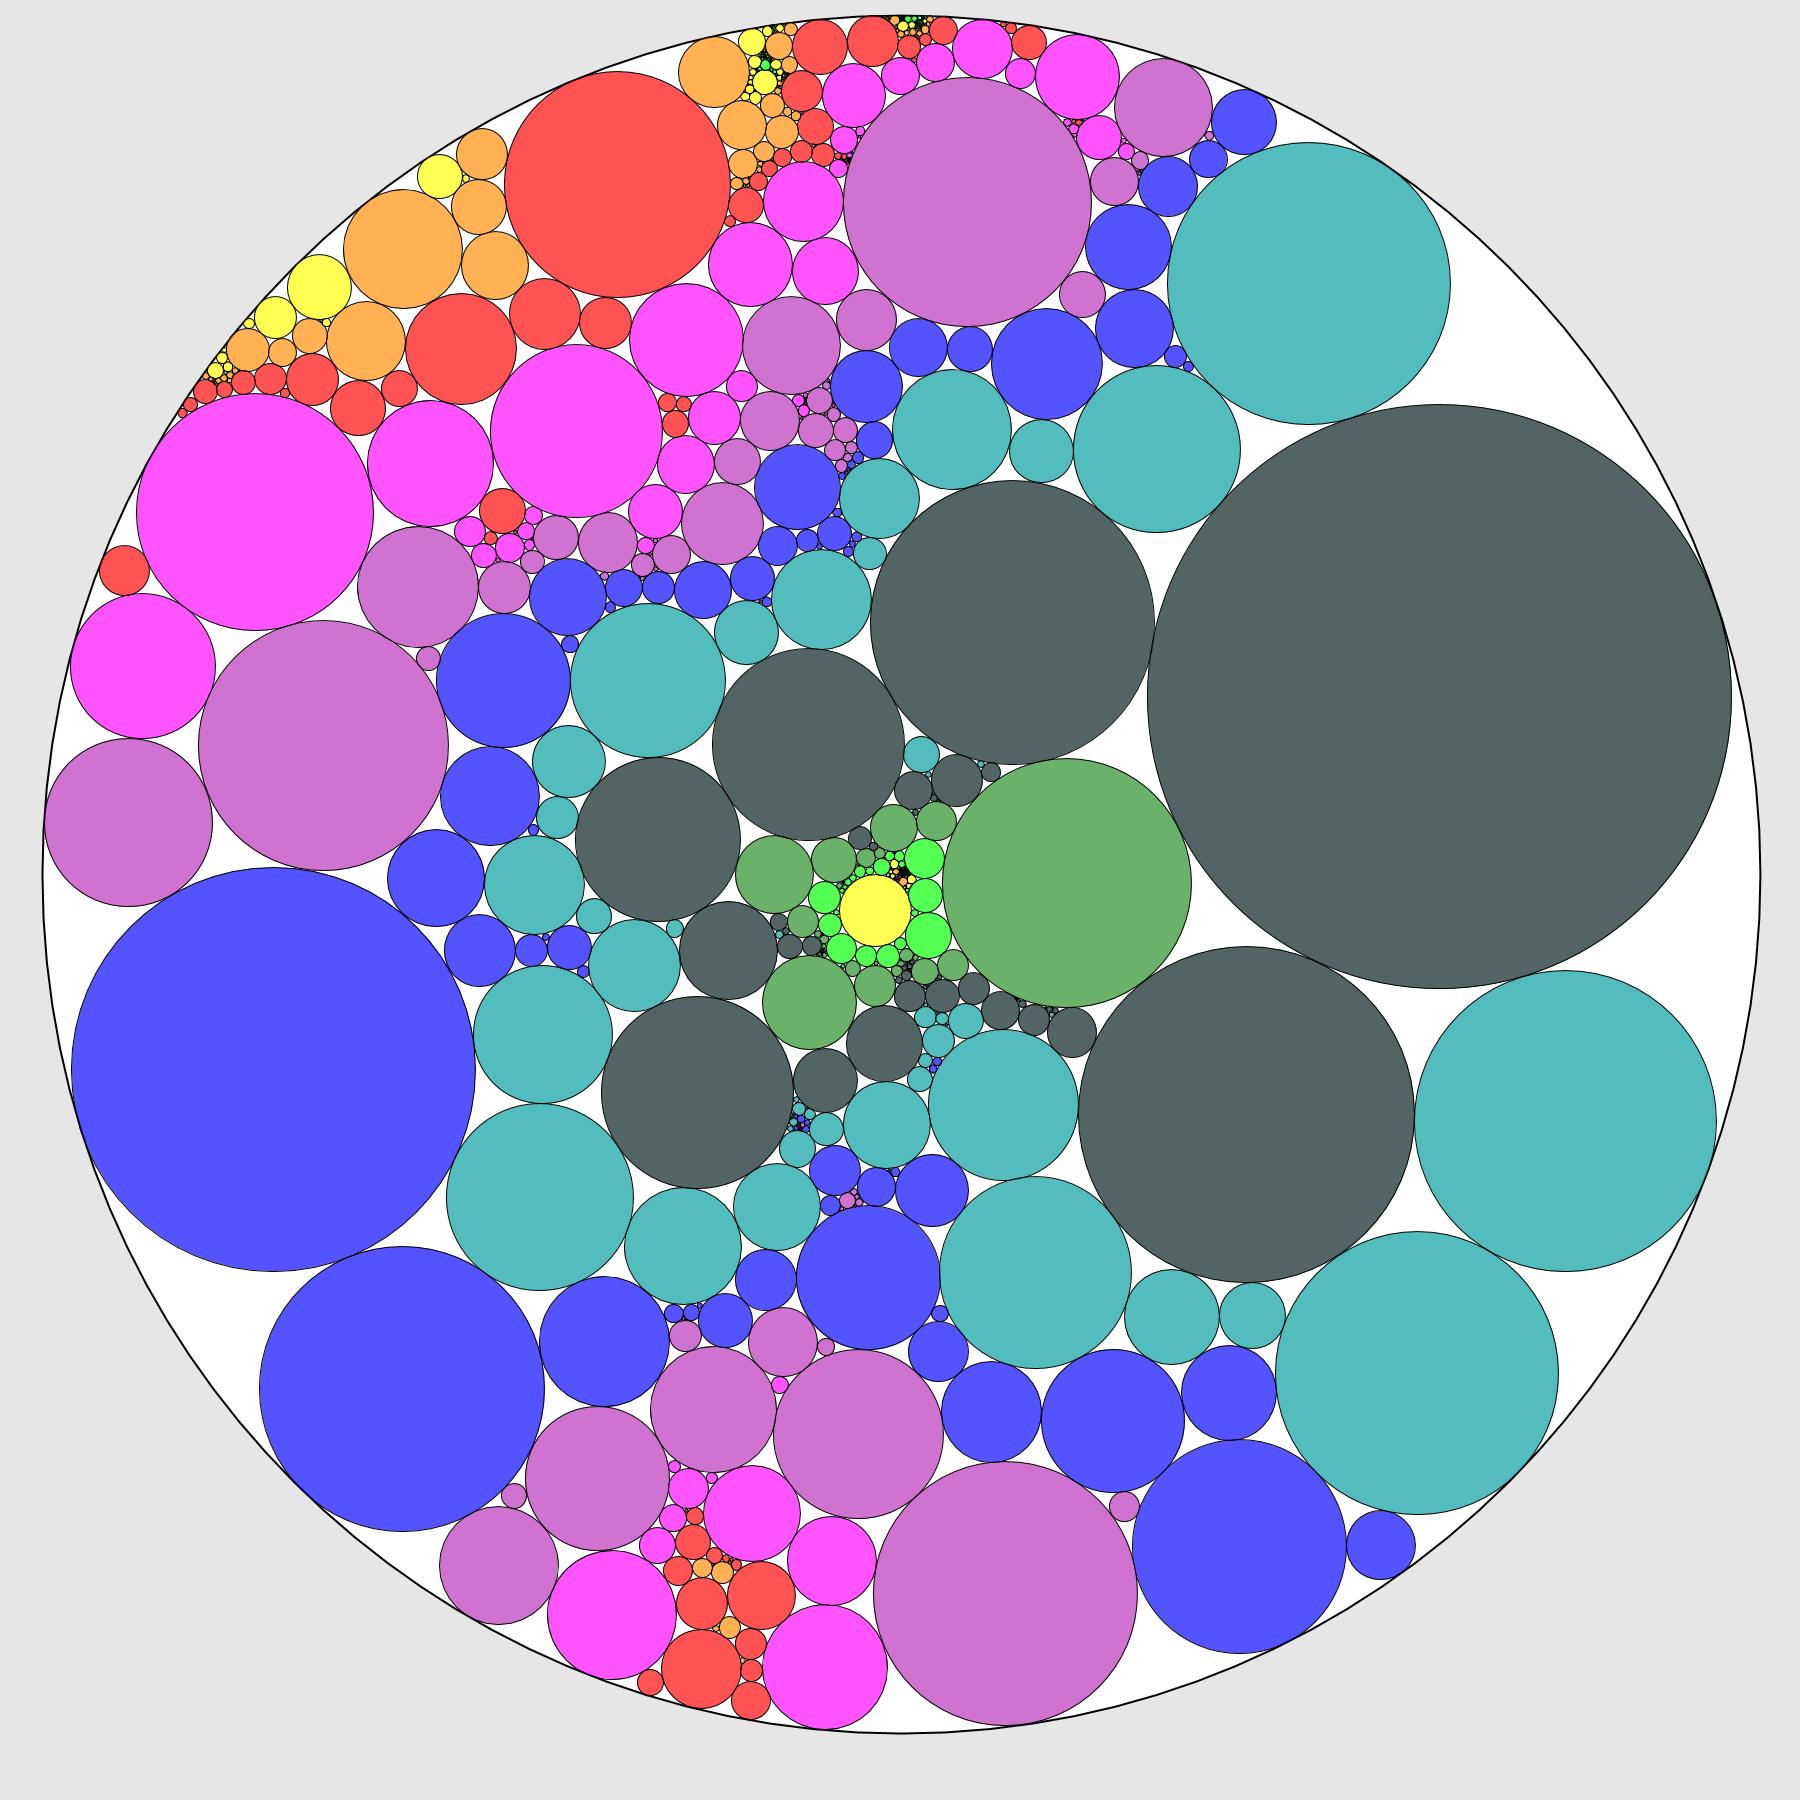
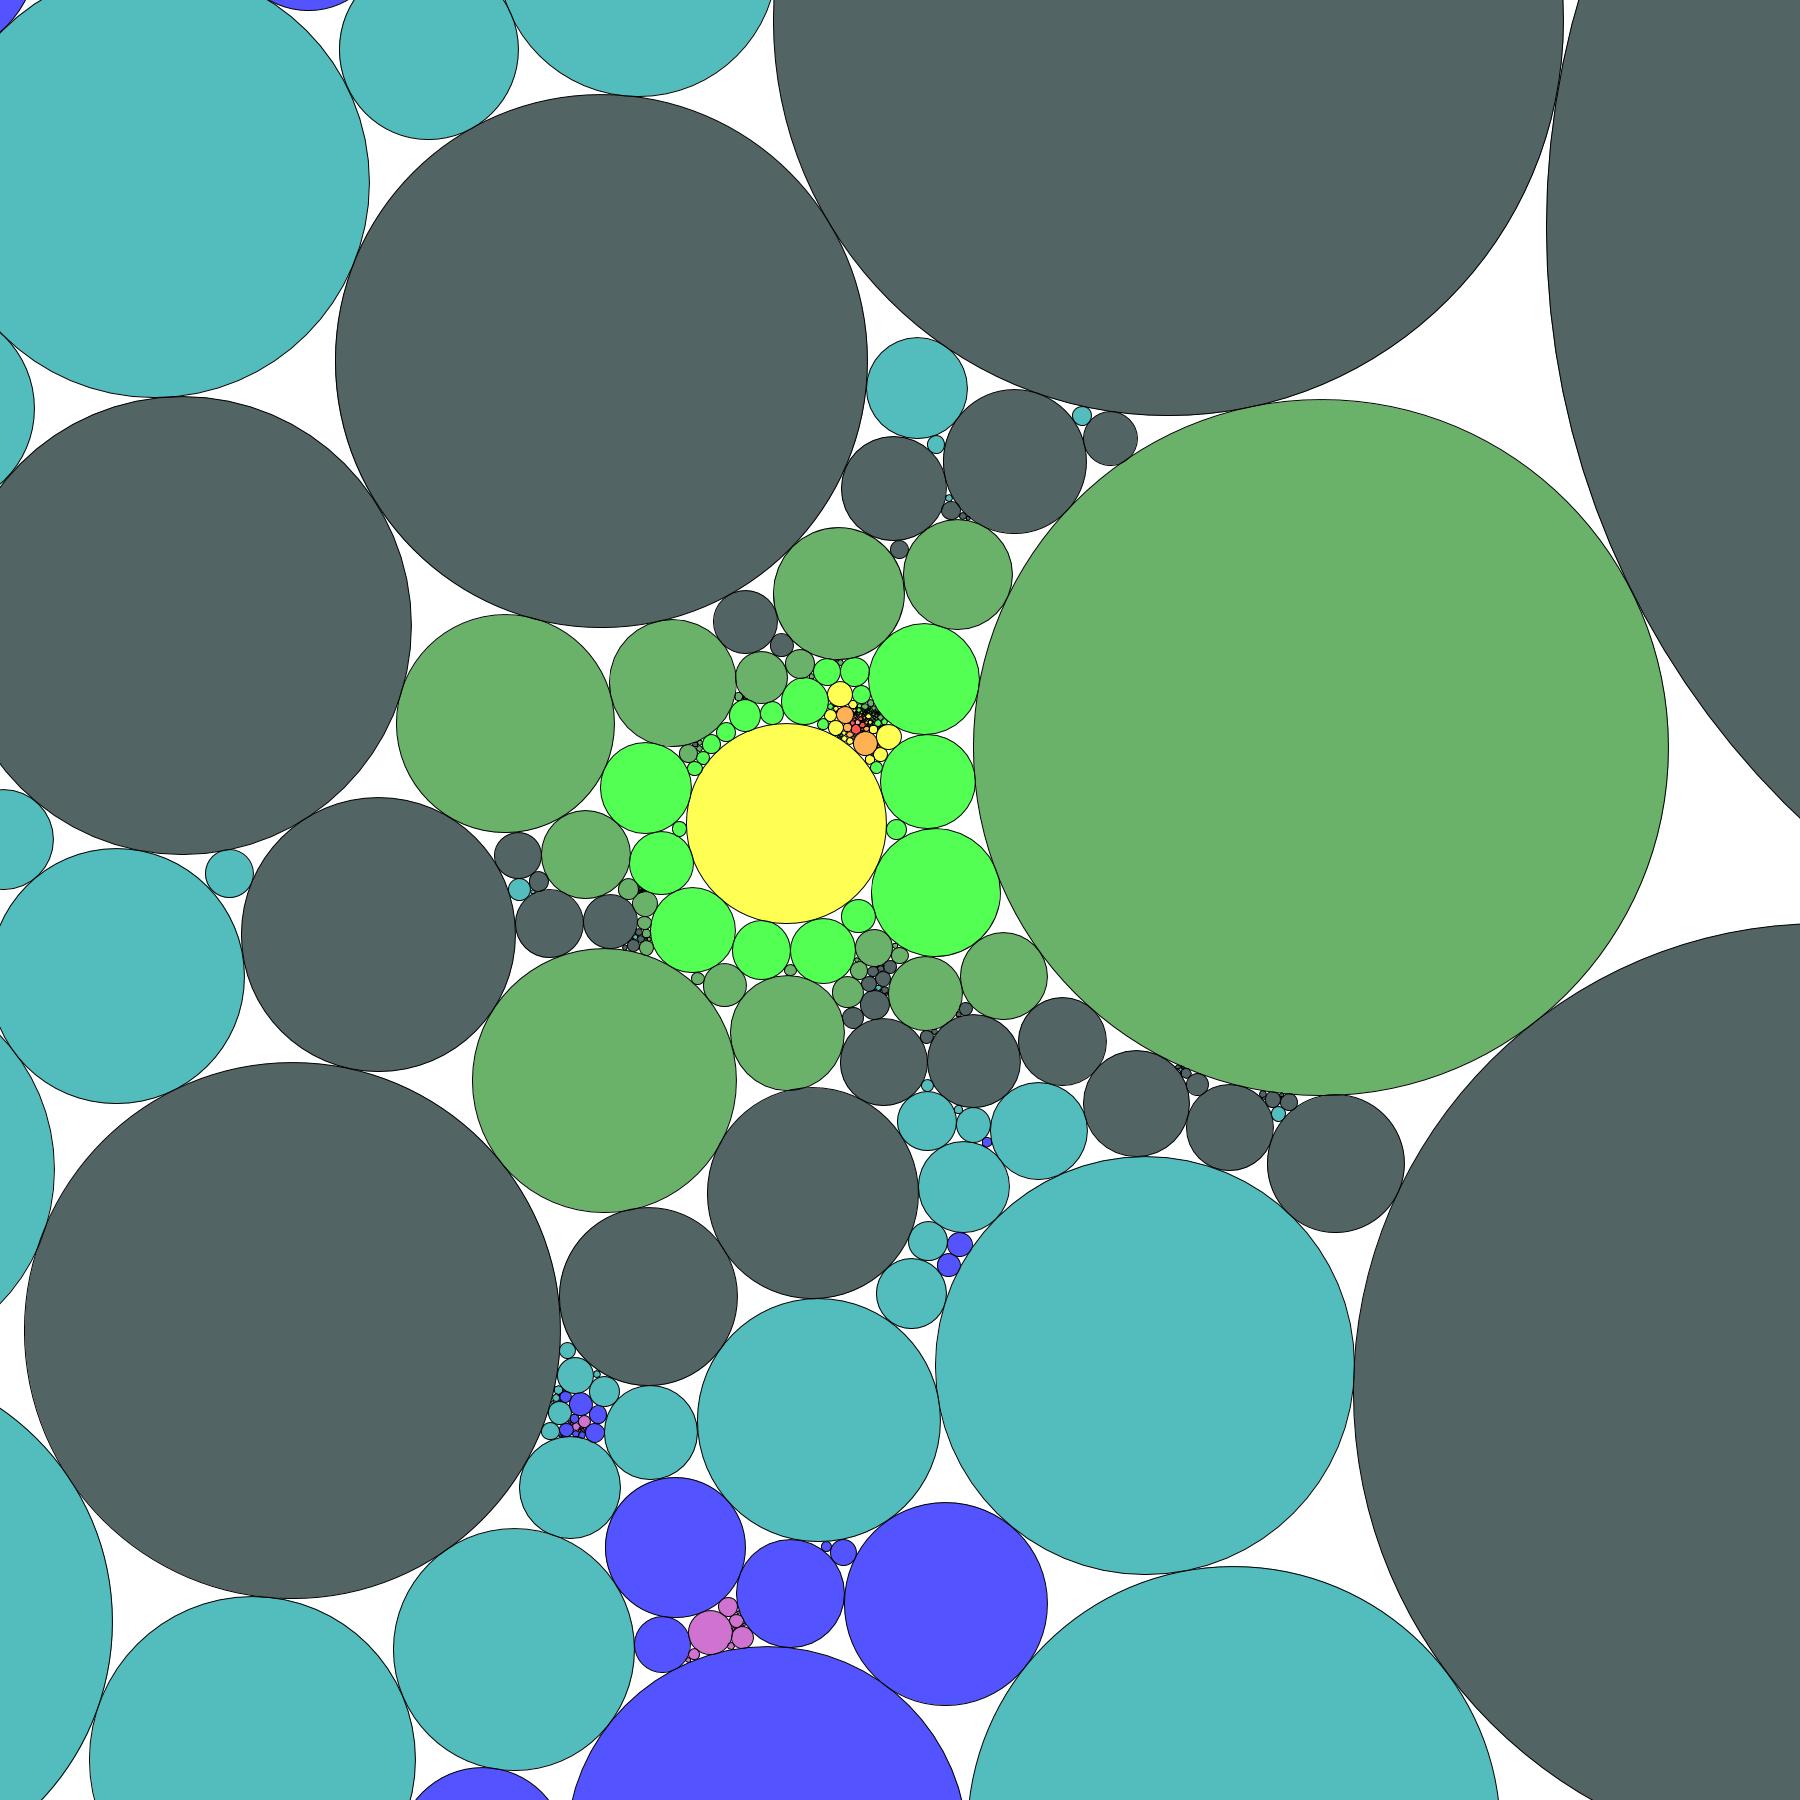
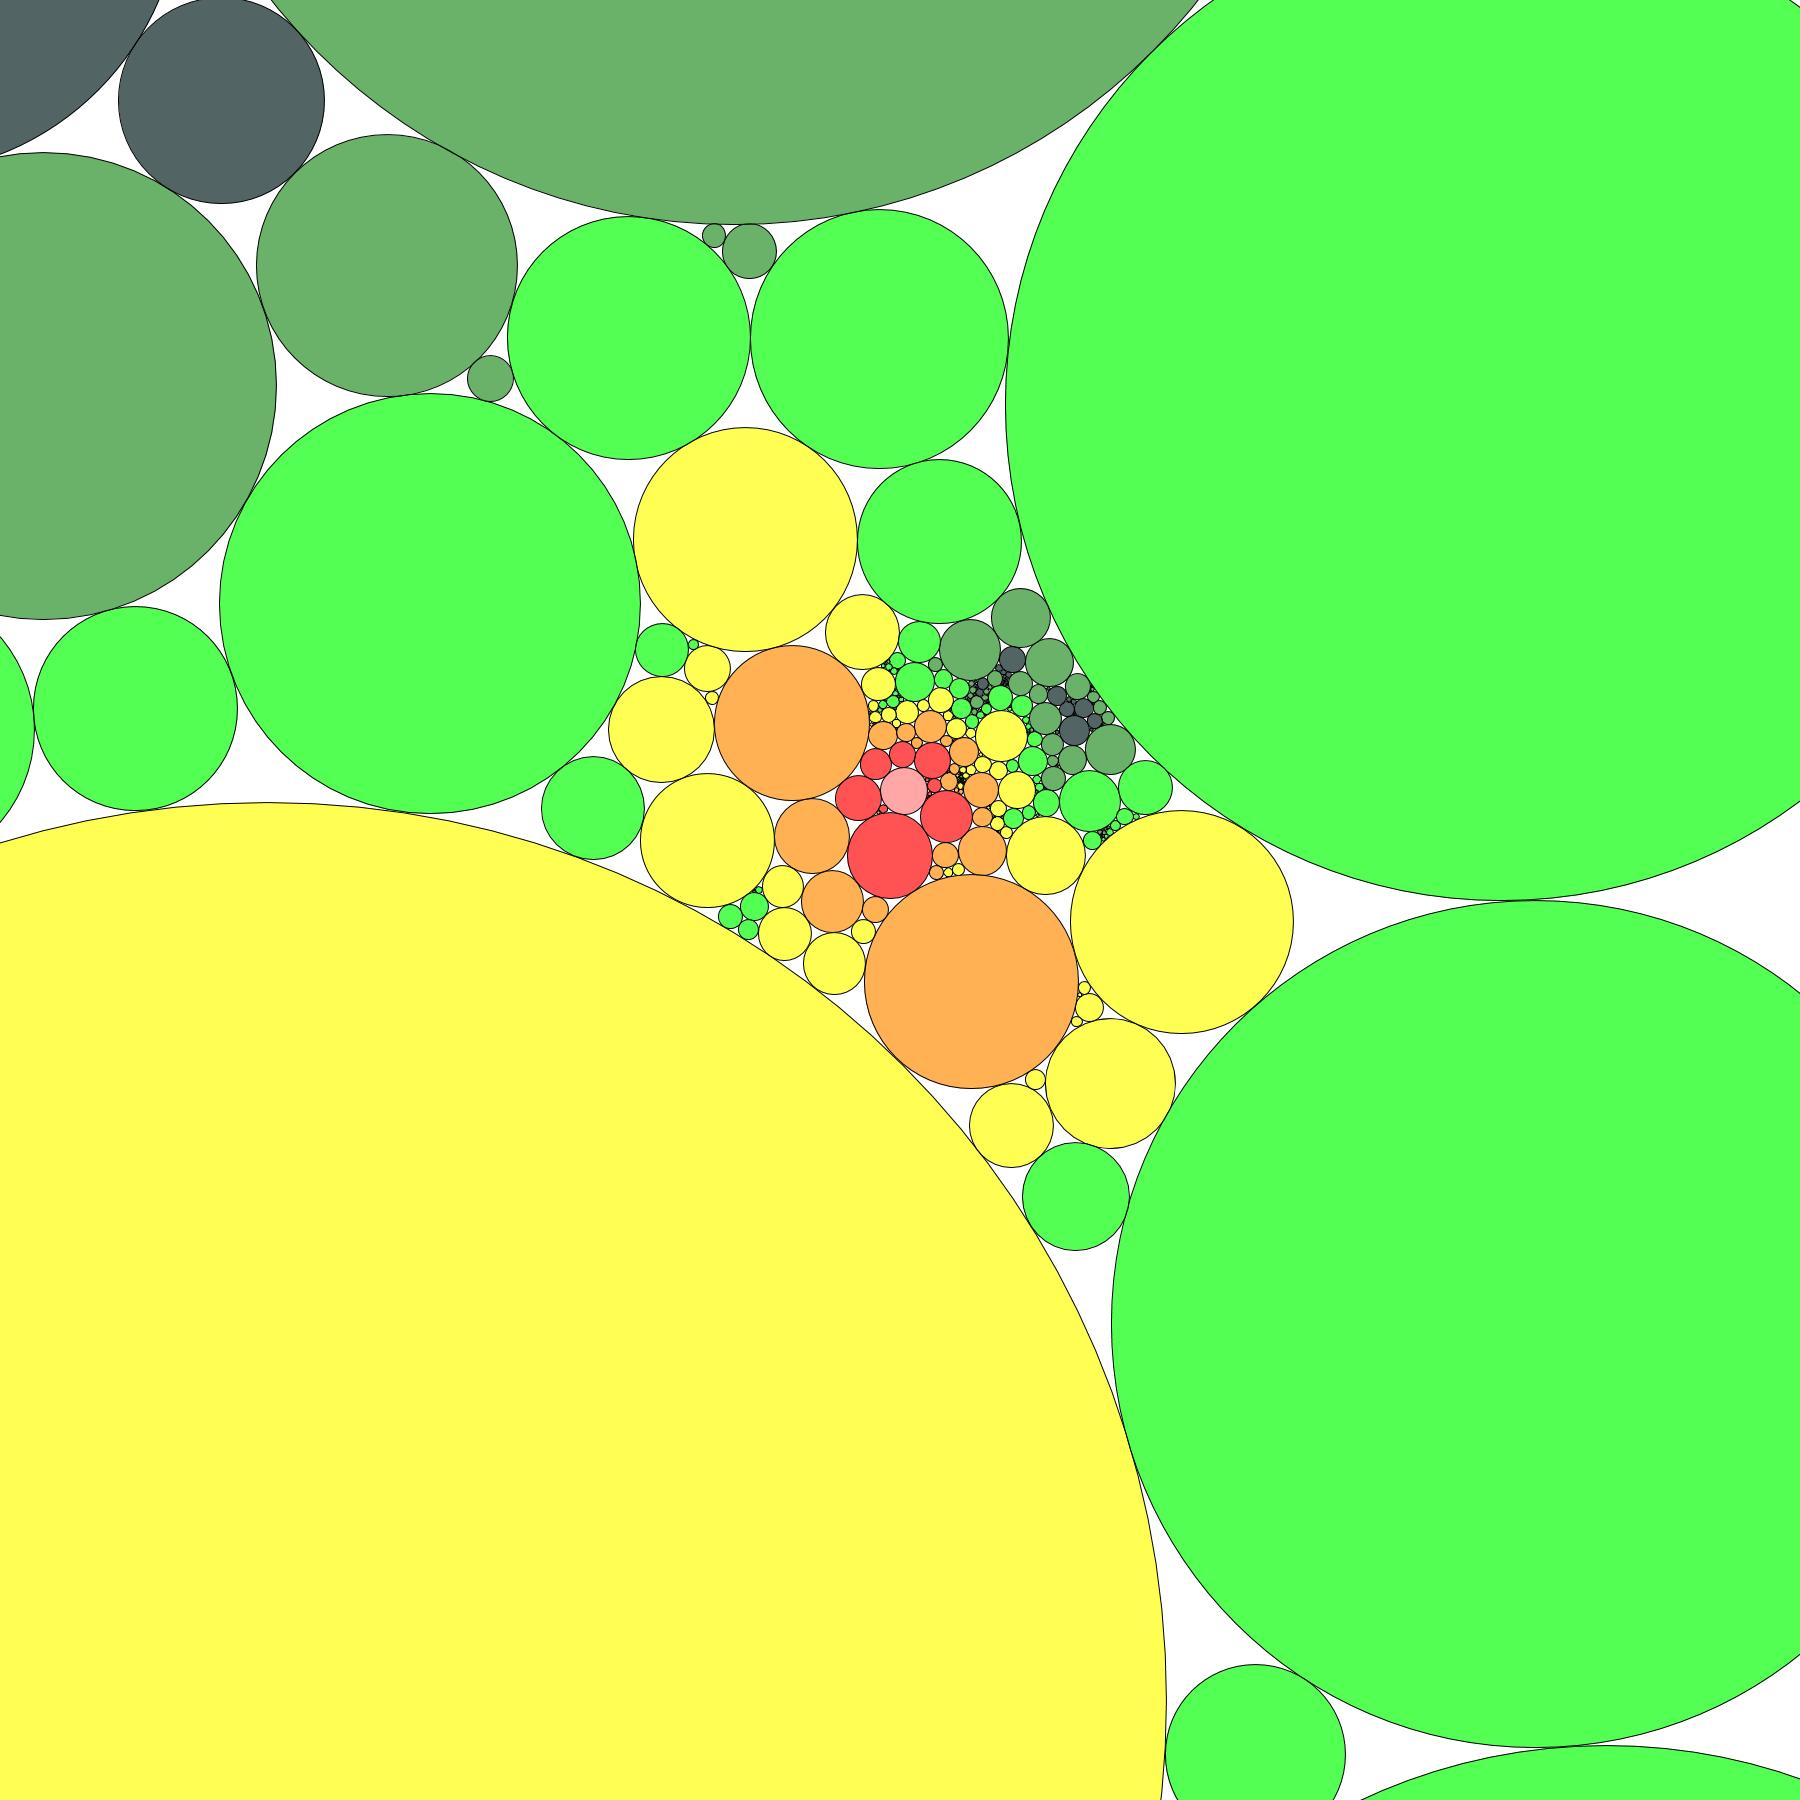
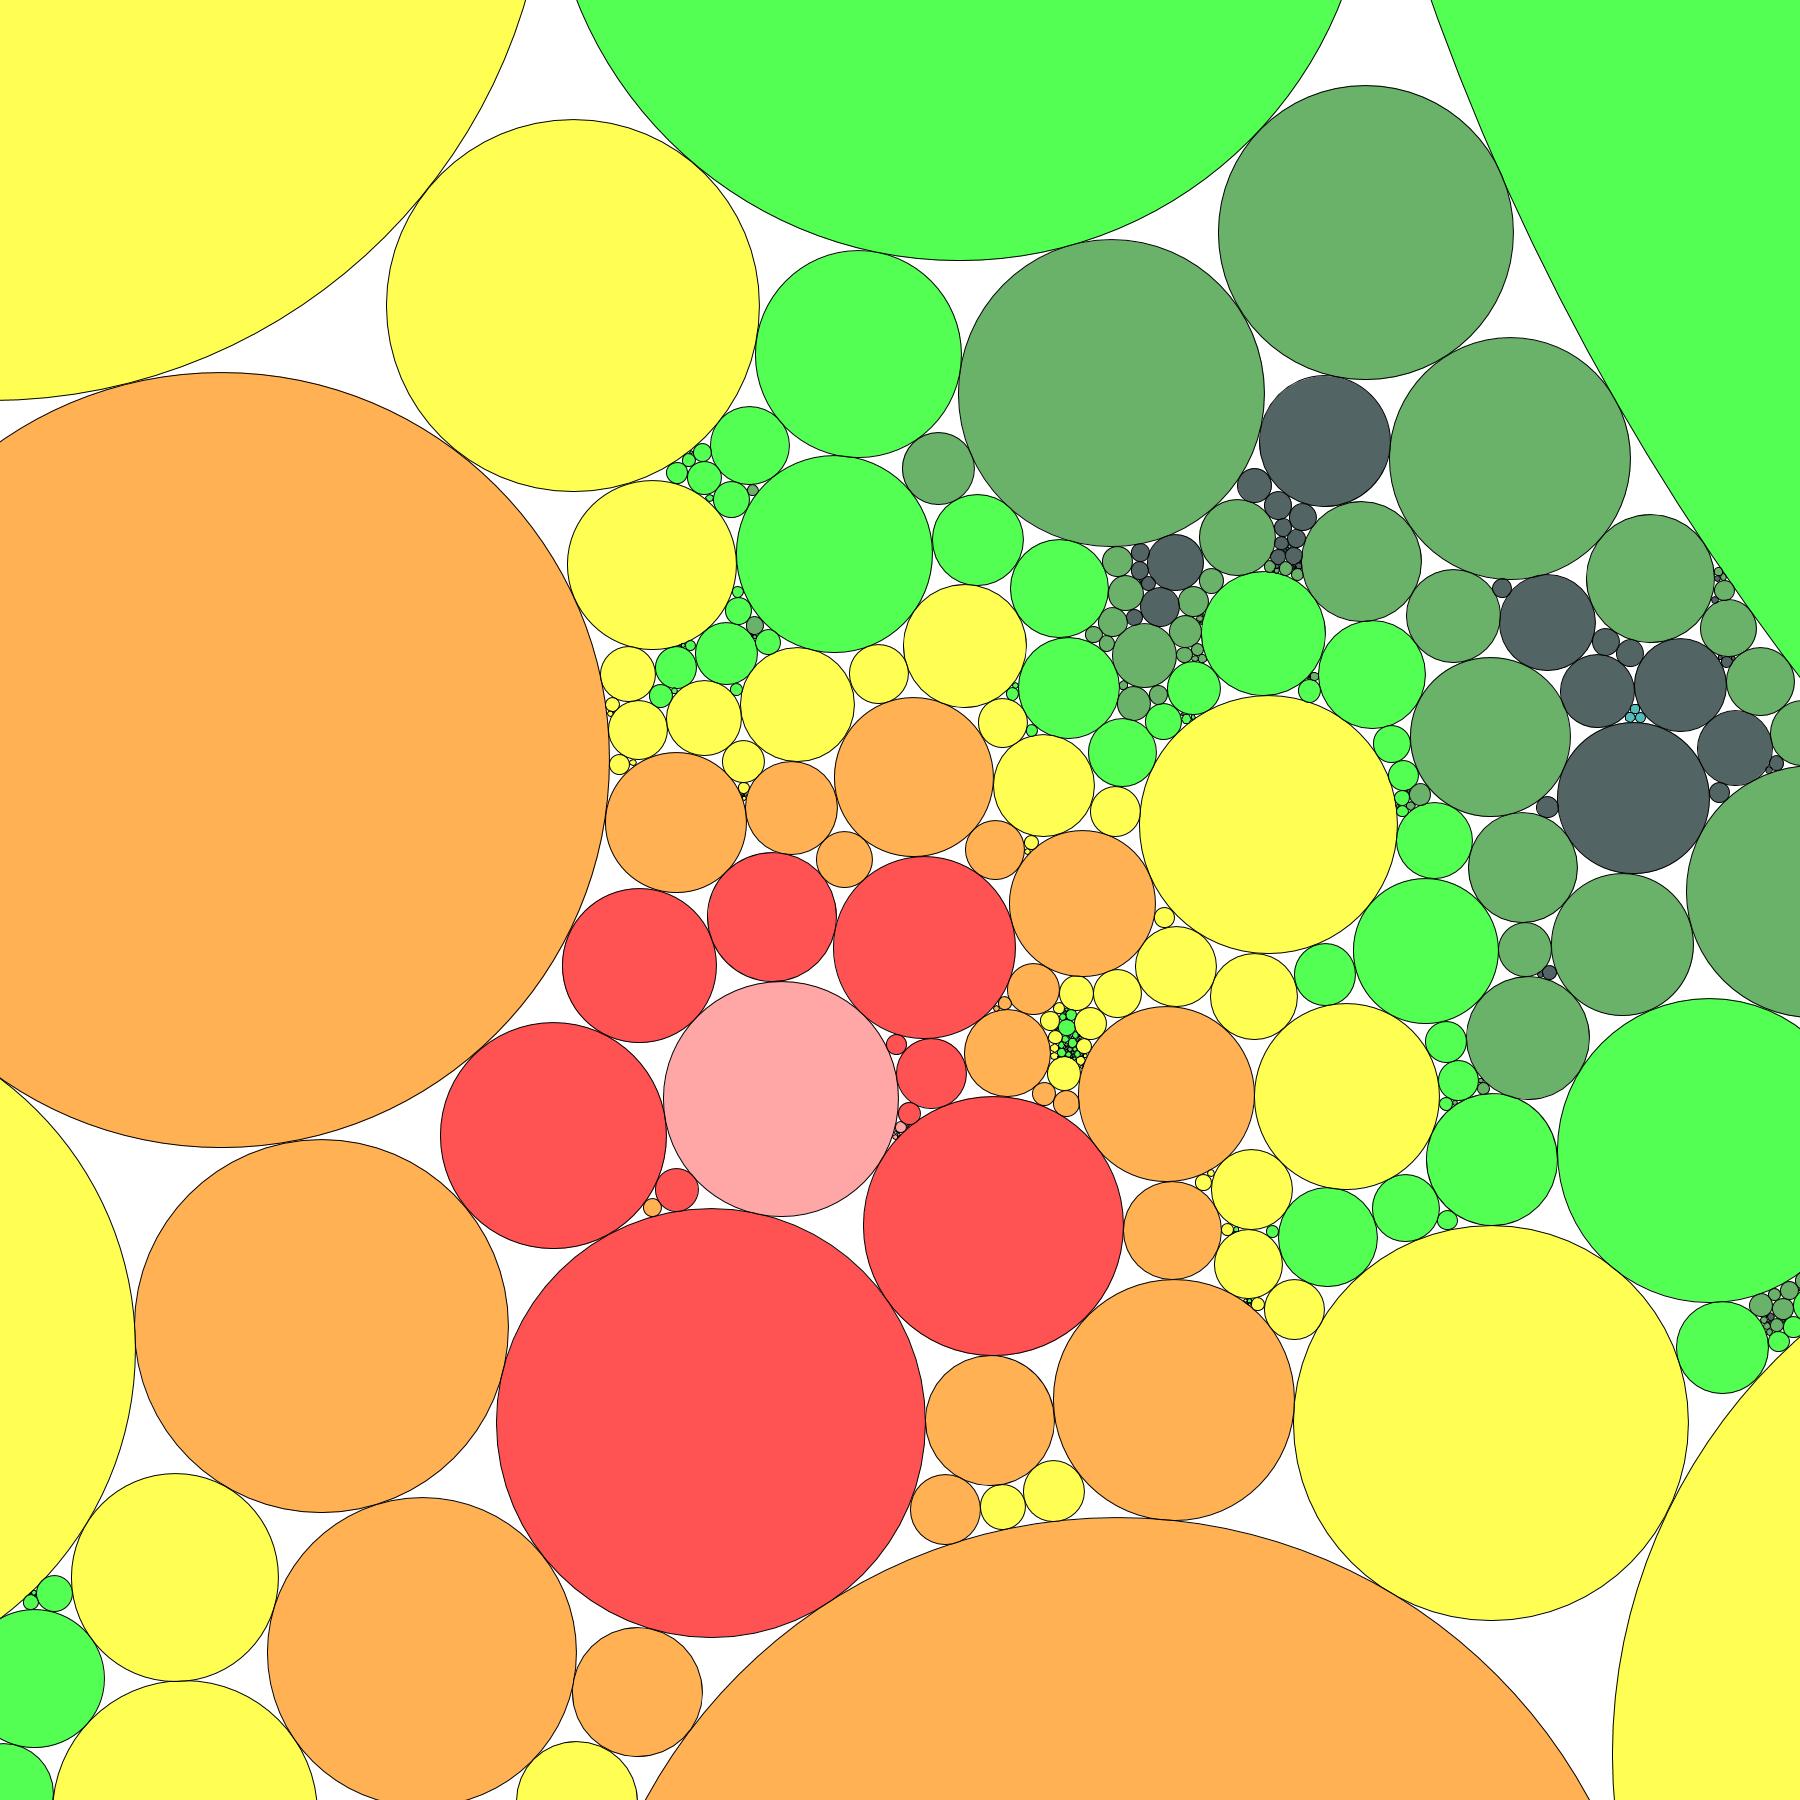
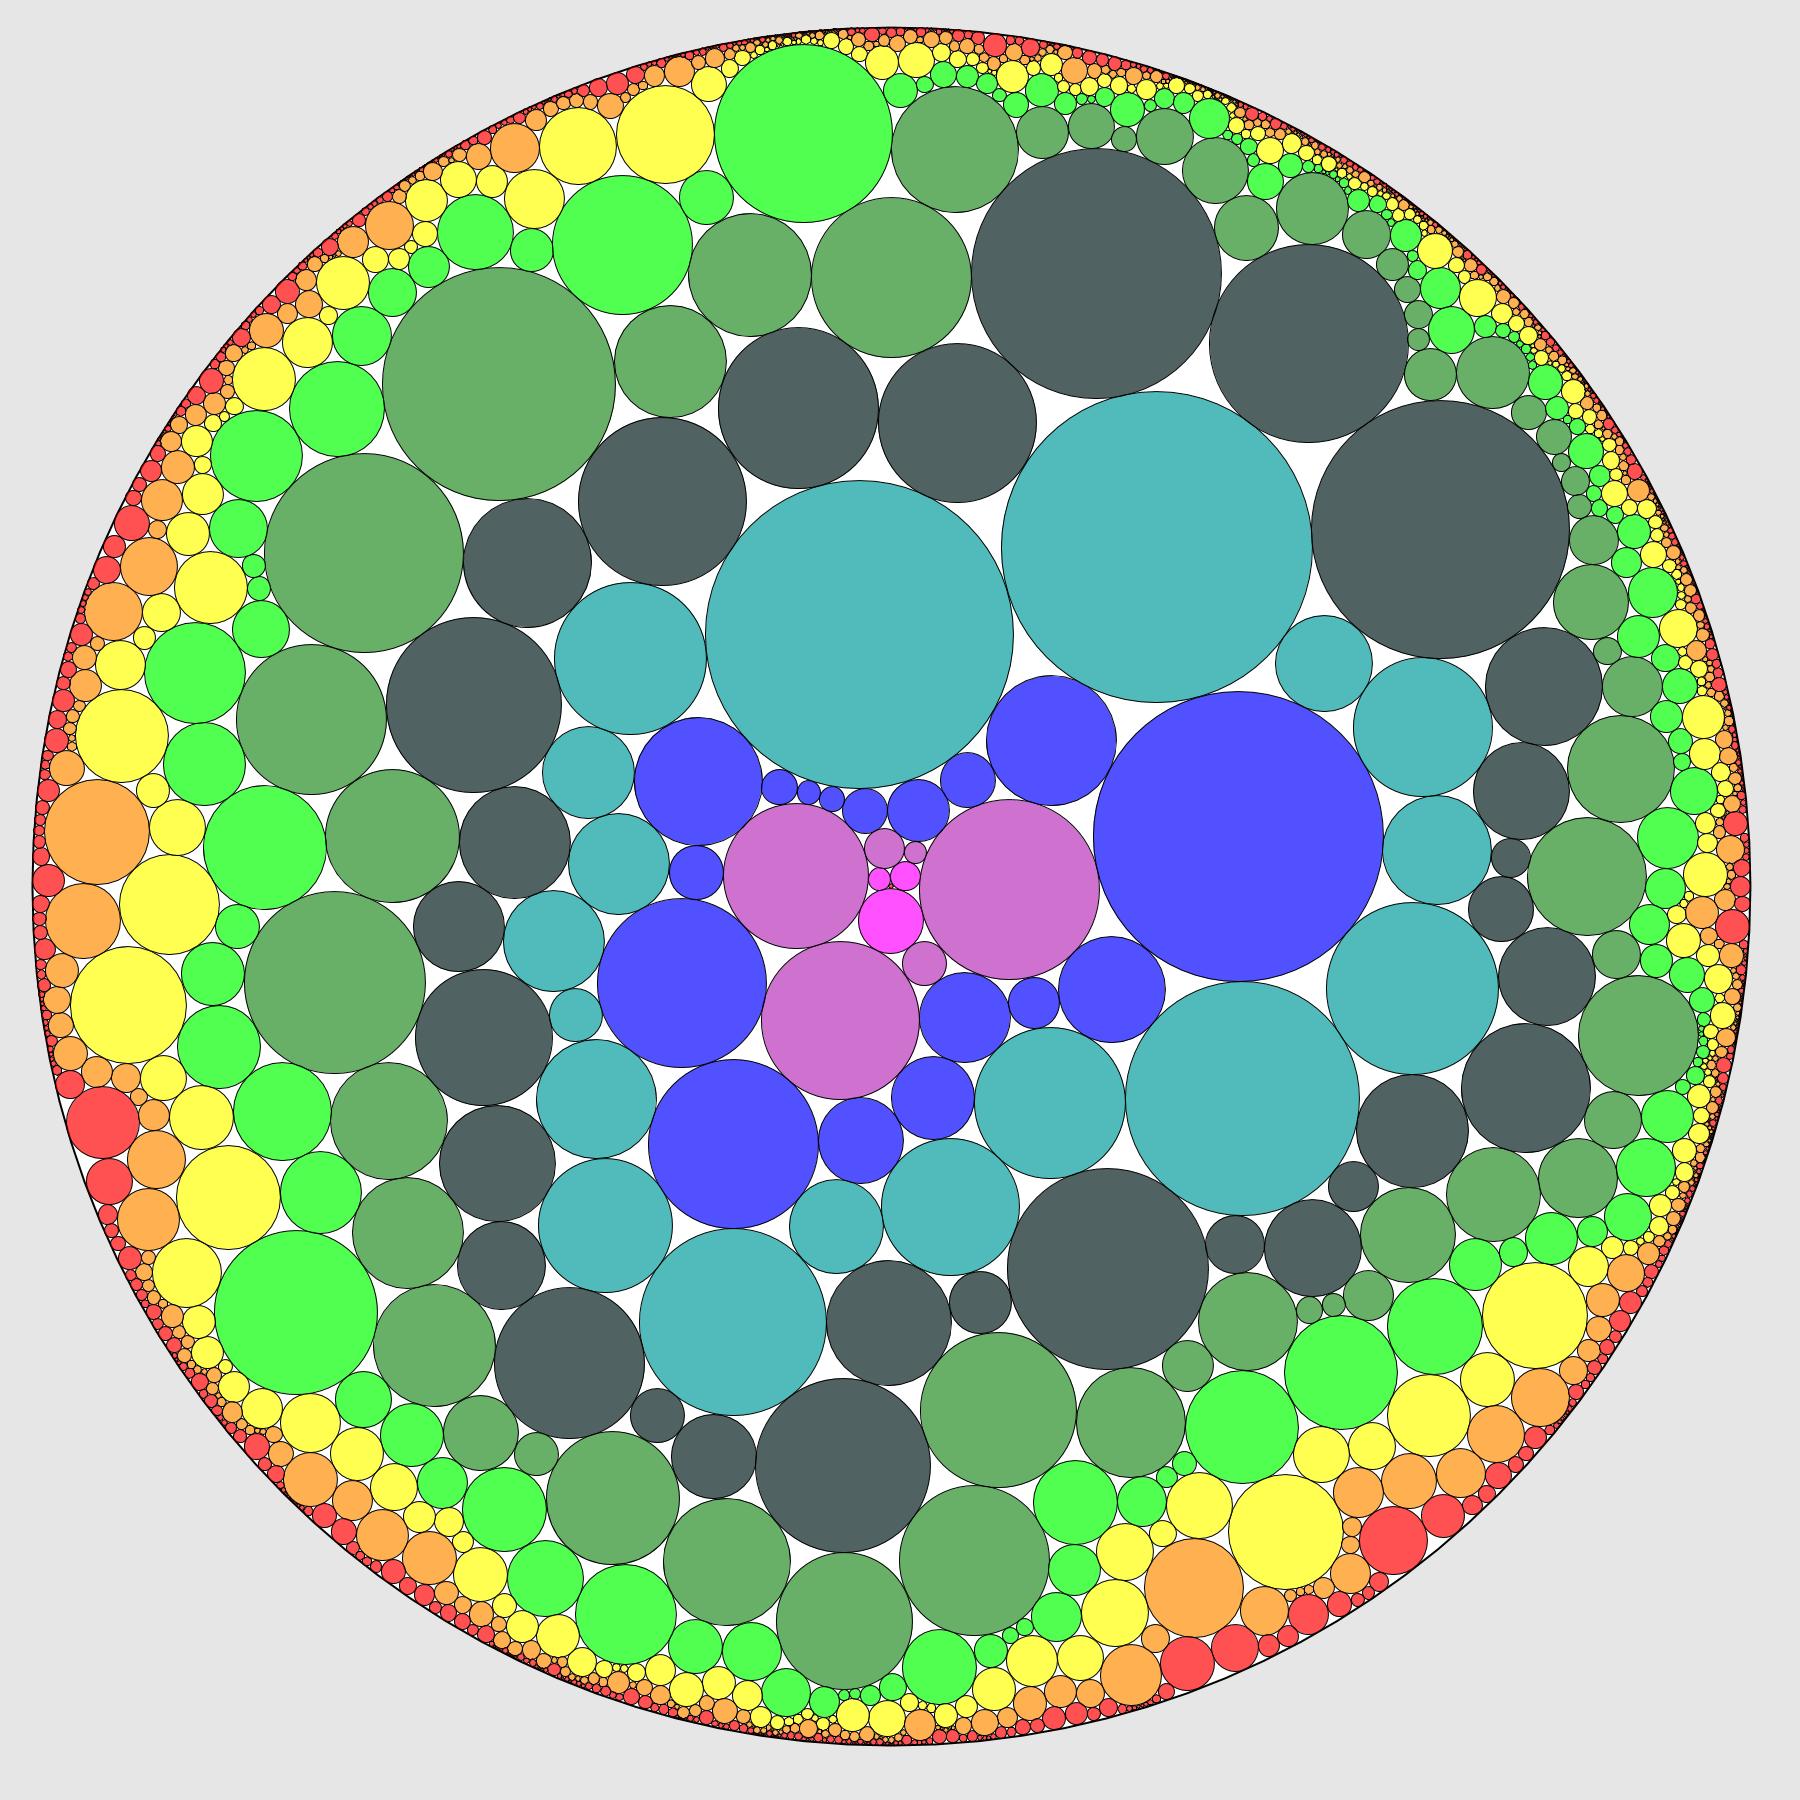
Zoom
These four pictures represent the same triangulation at different zoom levels. The colours correspond to the distances to the root.
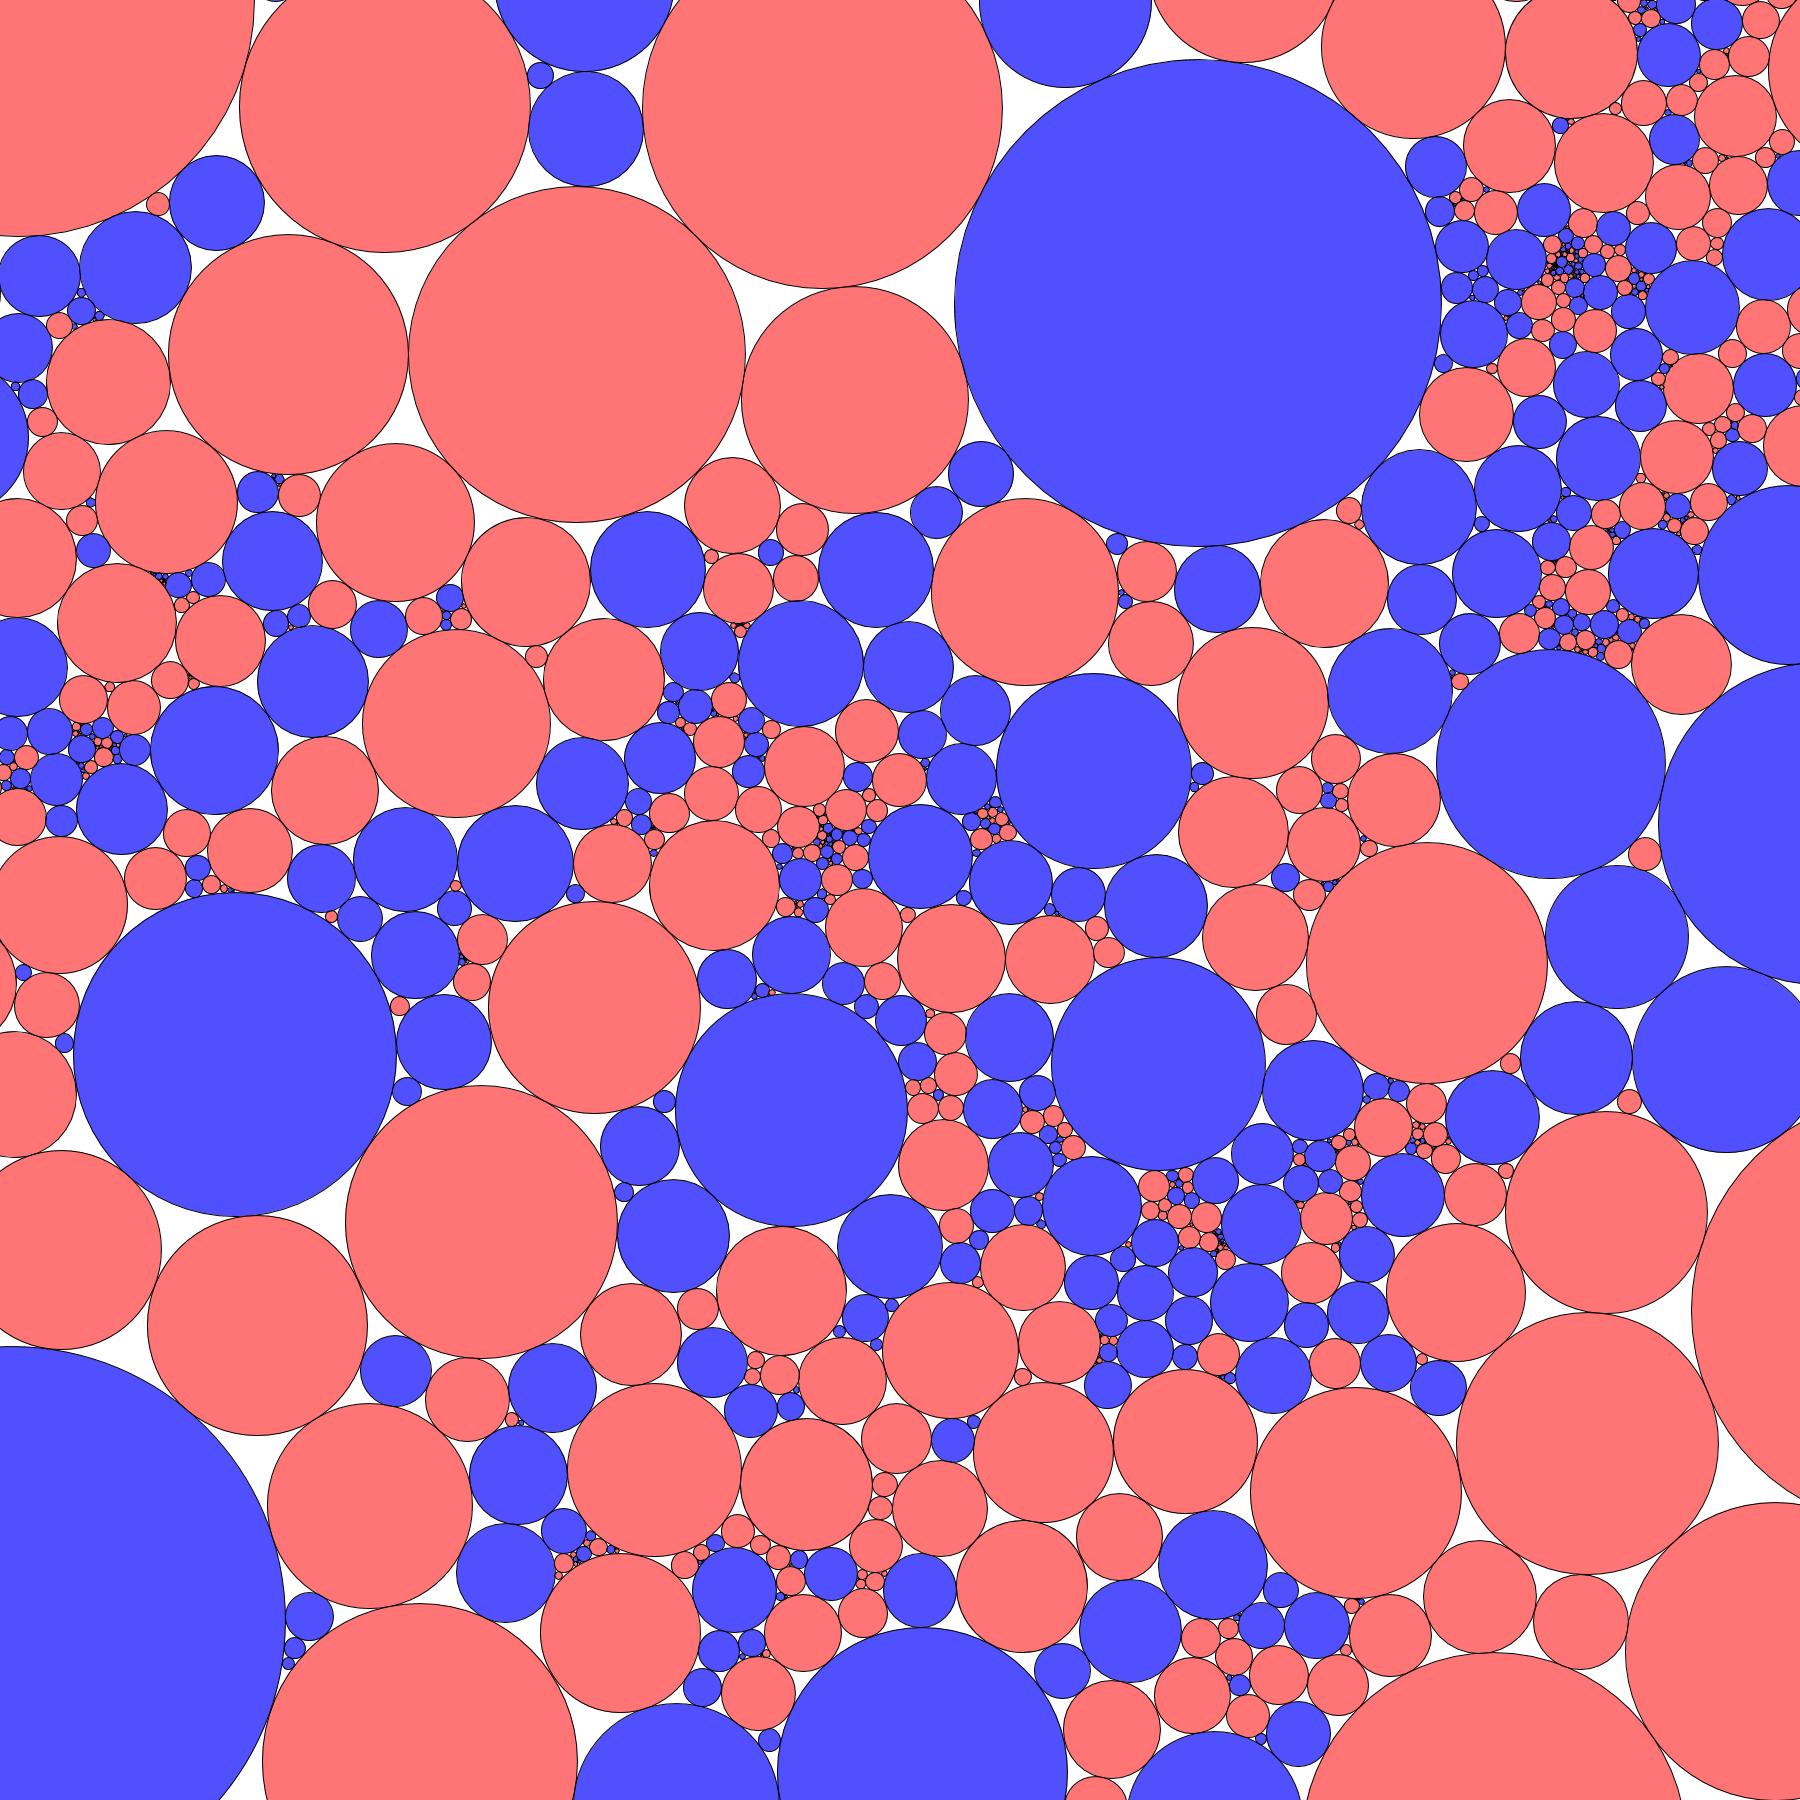
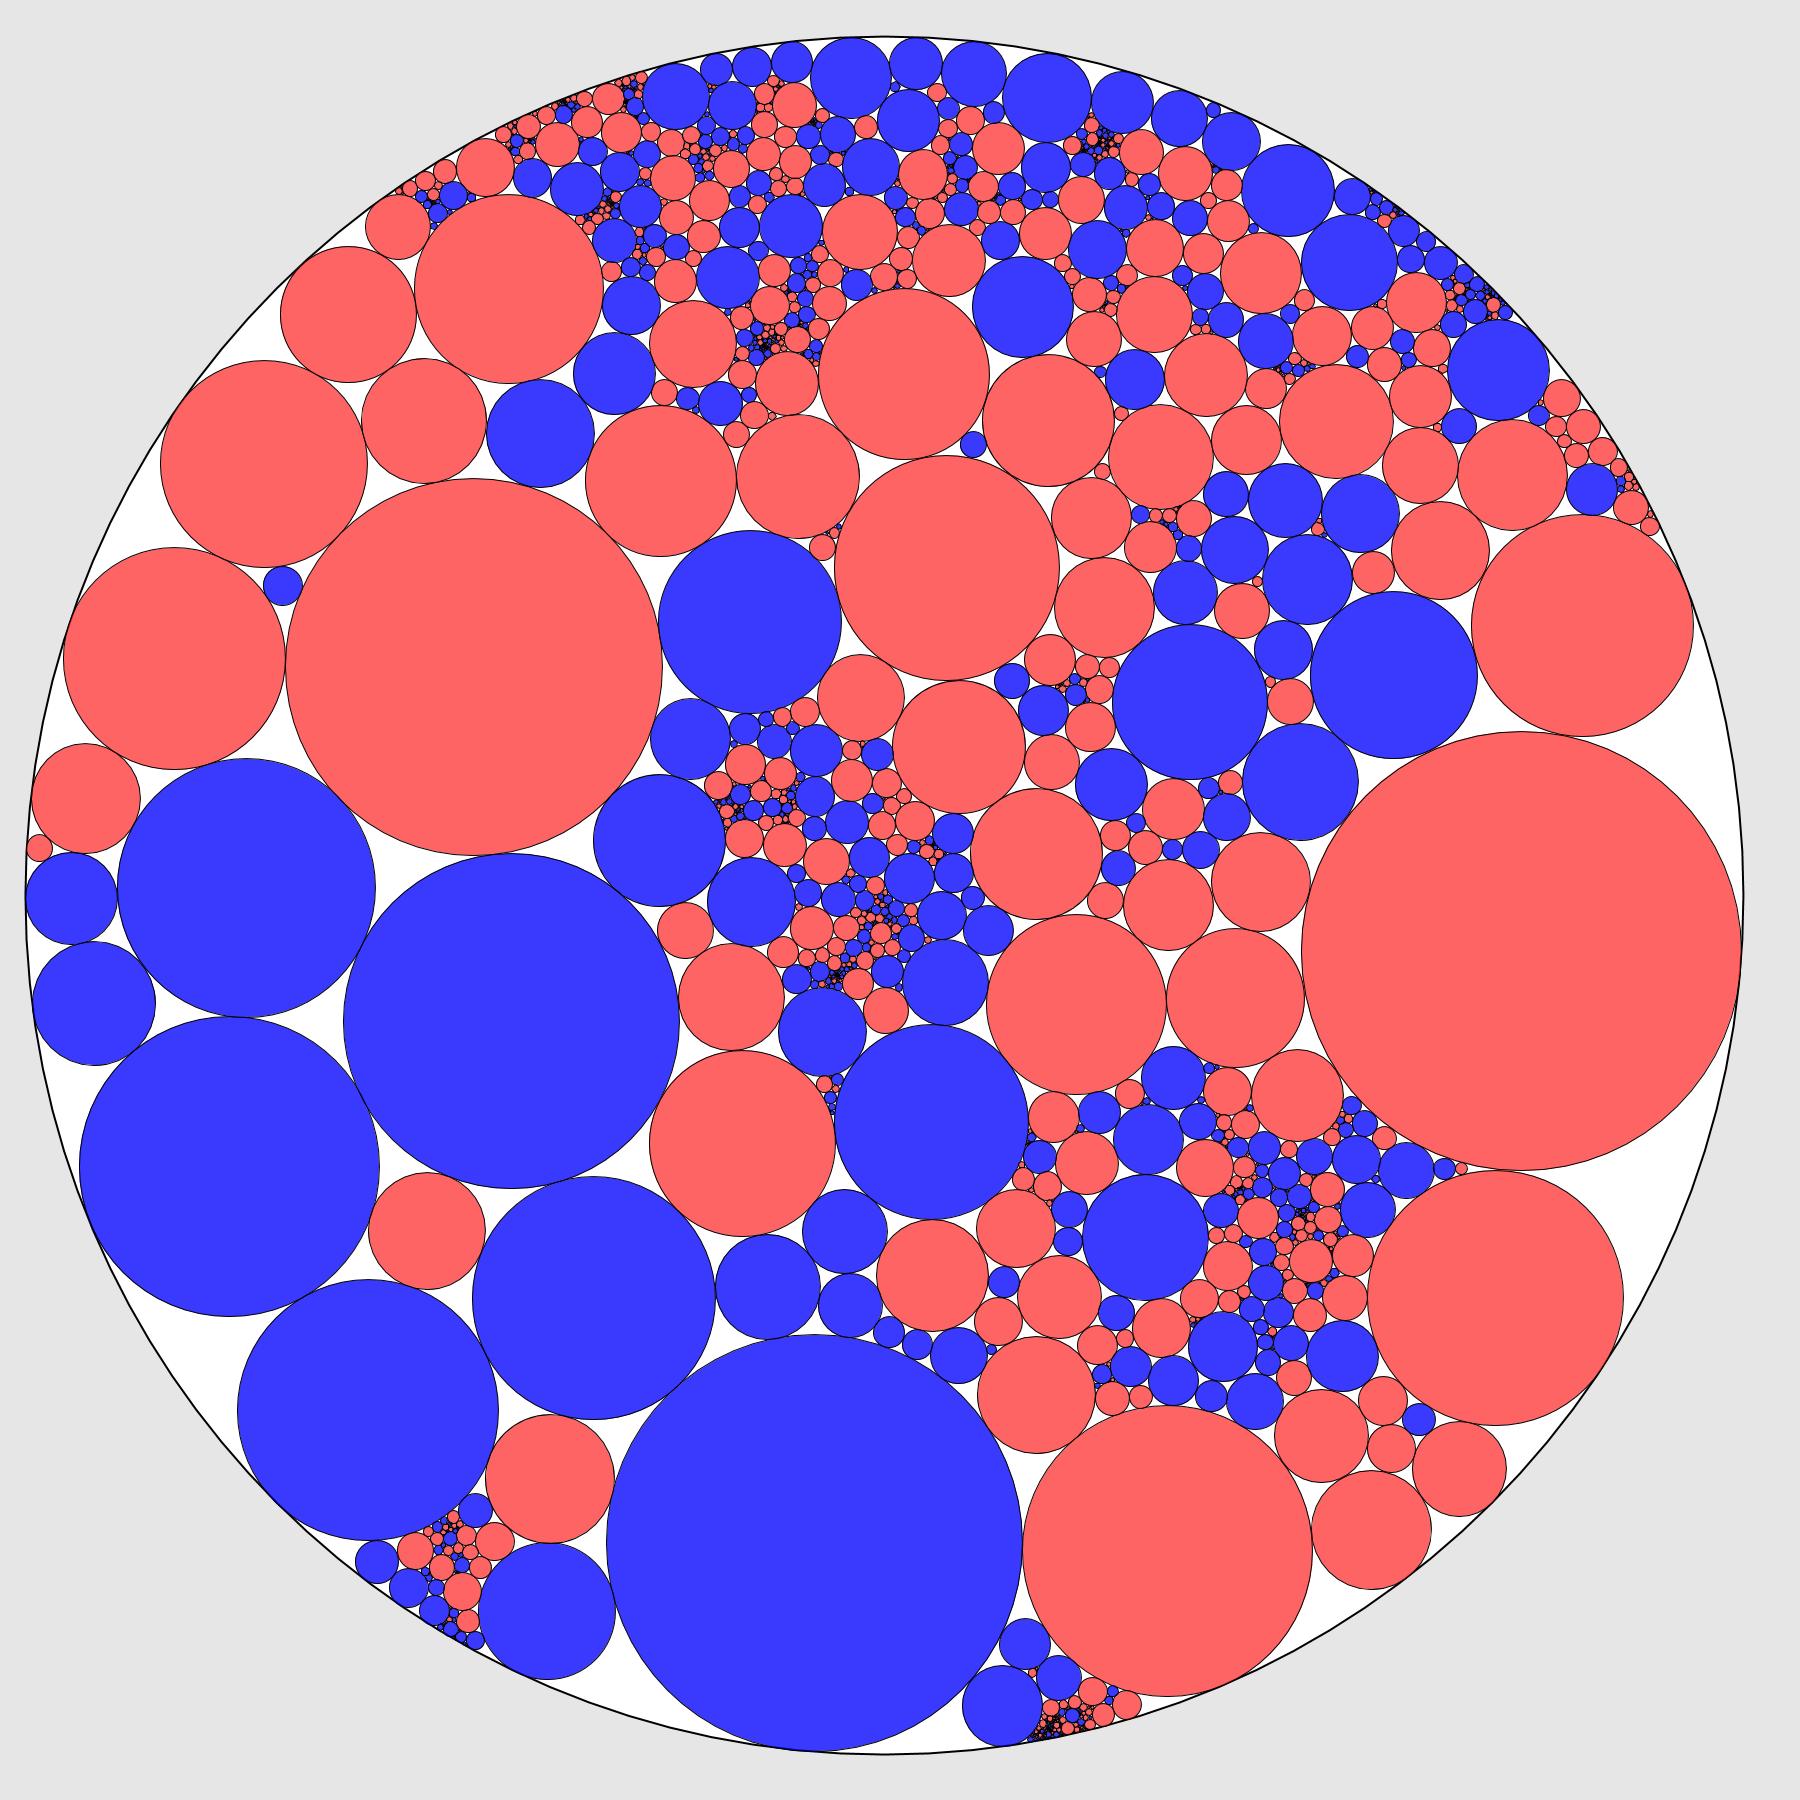
Percolation
Here, we have performed a critical percolation on the triangulation: each vertex has been coloured in blue or red with probability 1/2. On the right, the boundary condition is of the form "red-blue-red-blue", and there is a red path between the two red segments of the boundary.
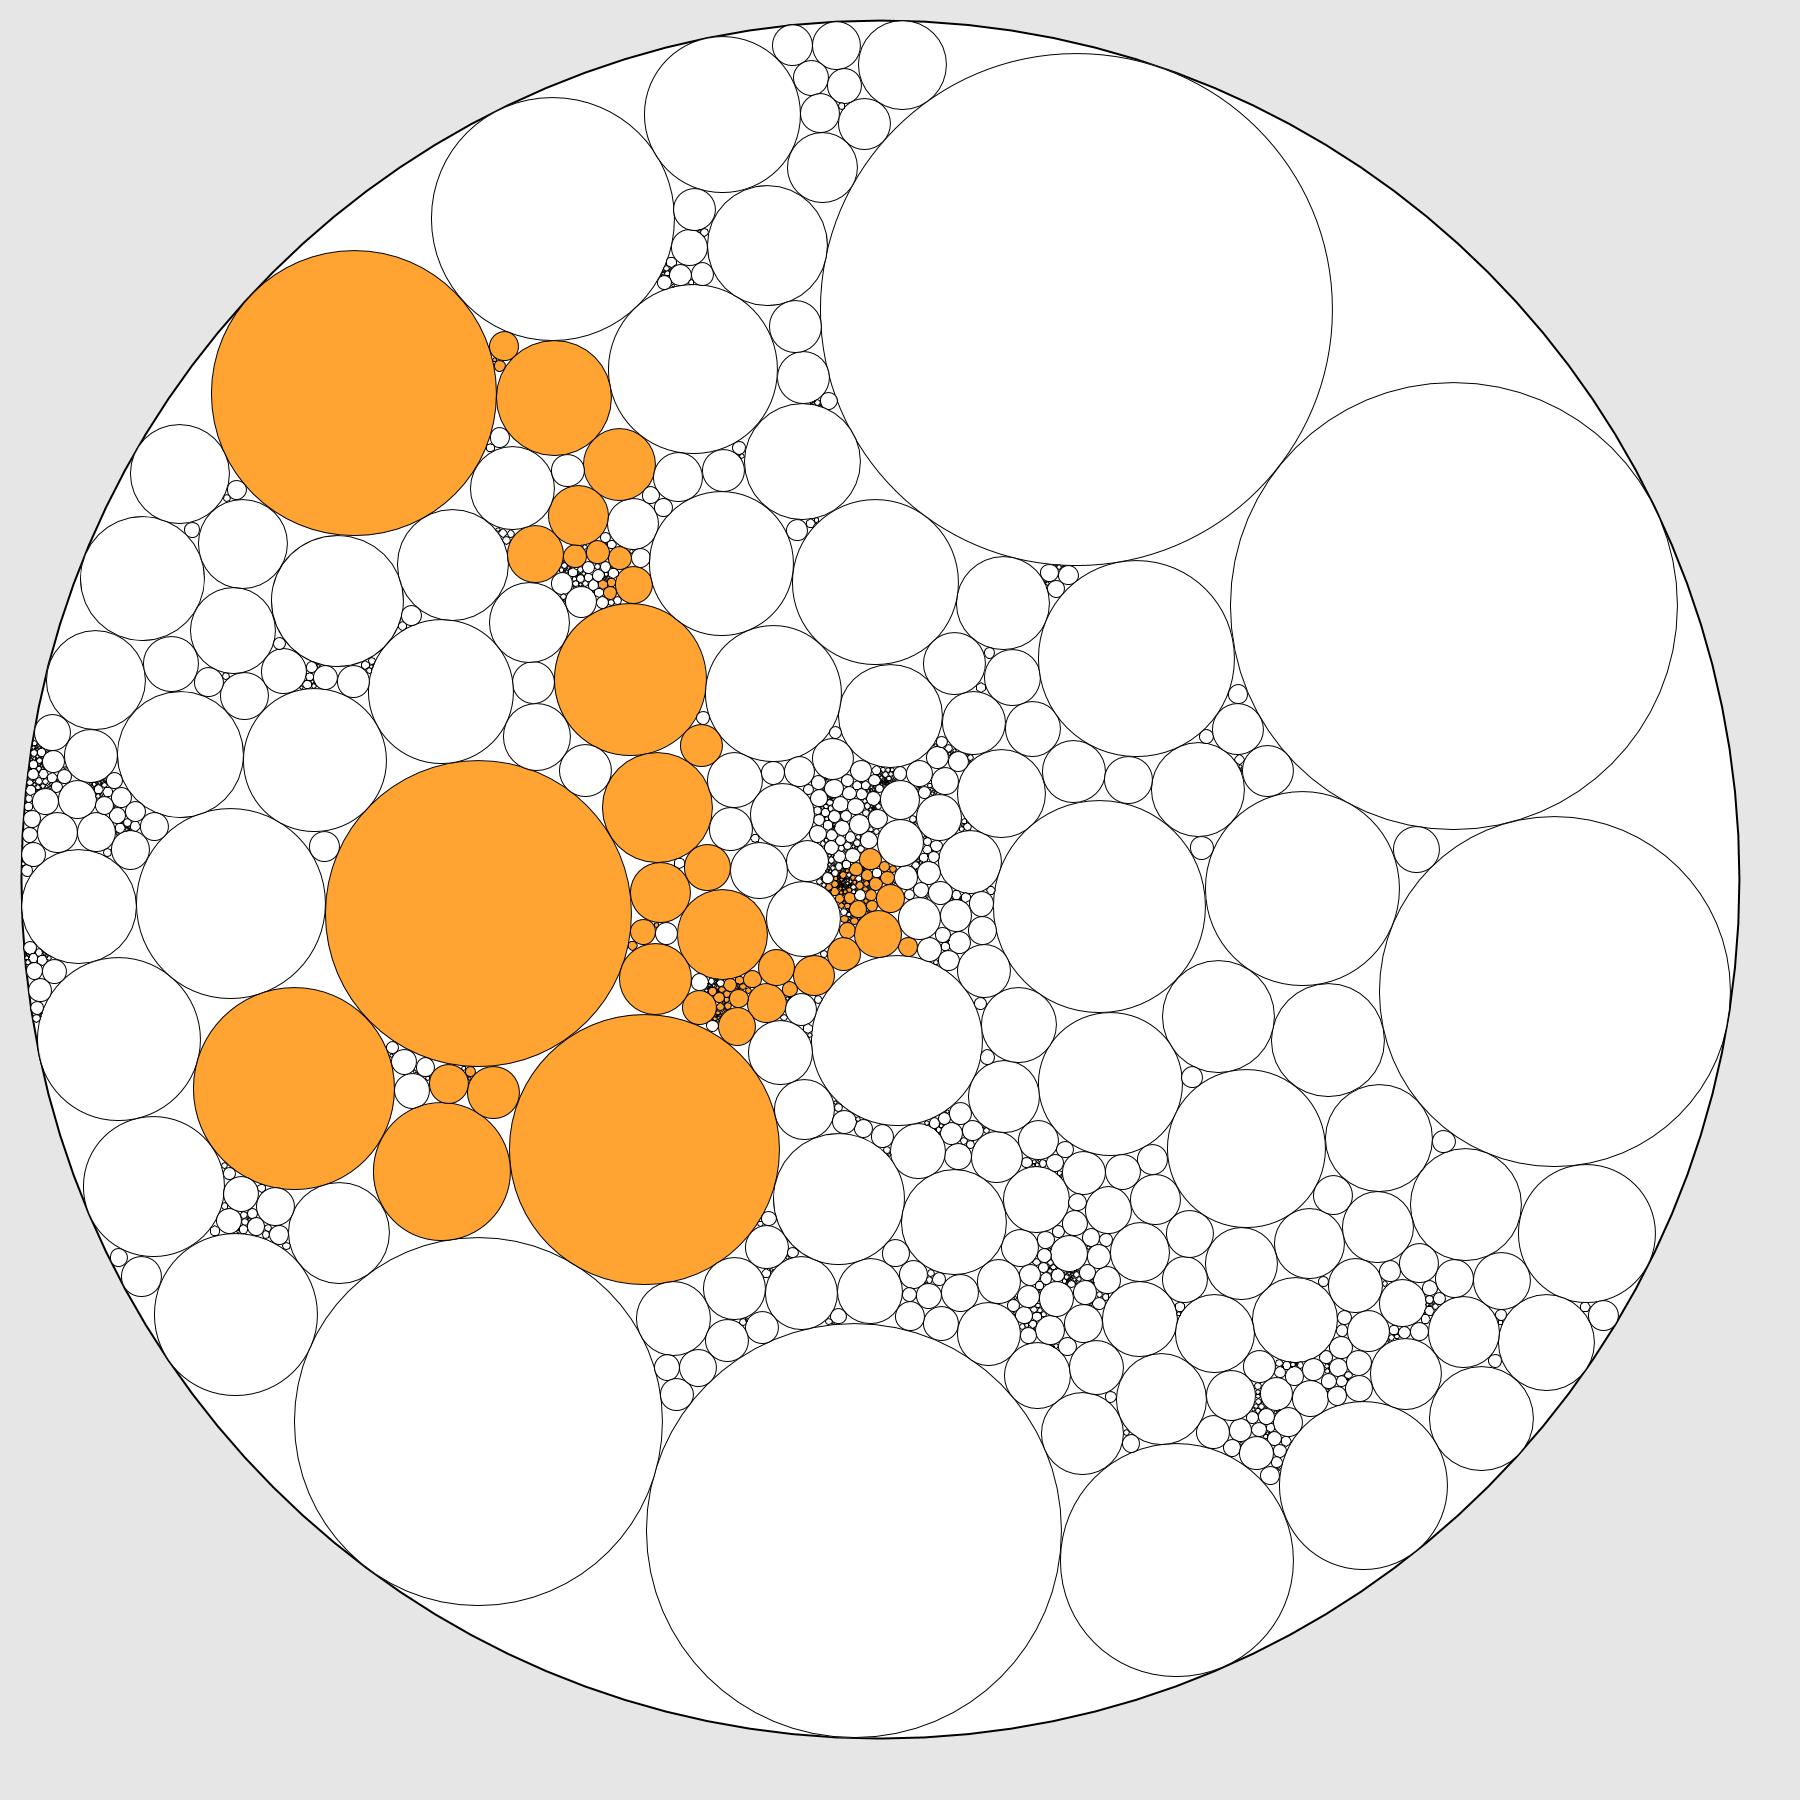
Simple random walk
In orange, the range of a simple random walk, started from the root and killed when hitting the boundary.
Causal Triangulations
These three pictures represent causal triangulations, i.e. triangulations obtained from a tree by joining vertices from the same generation of from neighbour generations. All three have been obtained from Galton-Watson trees conditioned to survive. On the left, the offspring distribution is geometric, with parameter 1/2. In the center, it is a heavy-tailed critical distribution lying in the attraction domain of a 3/2-stable law (more precisely, it is the distribution that appears in the Krikun decomposition of the UIPT). On the right, it is a supercritical geometric distribution. The heights of the trees are respectively 30, 15 and 12, and the numbers of vertices 1497, 6674 et 2028.
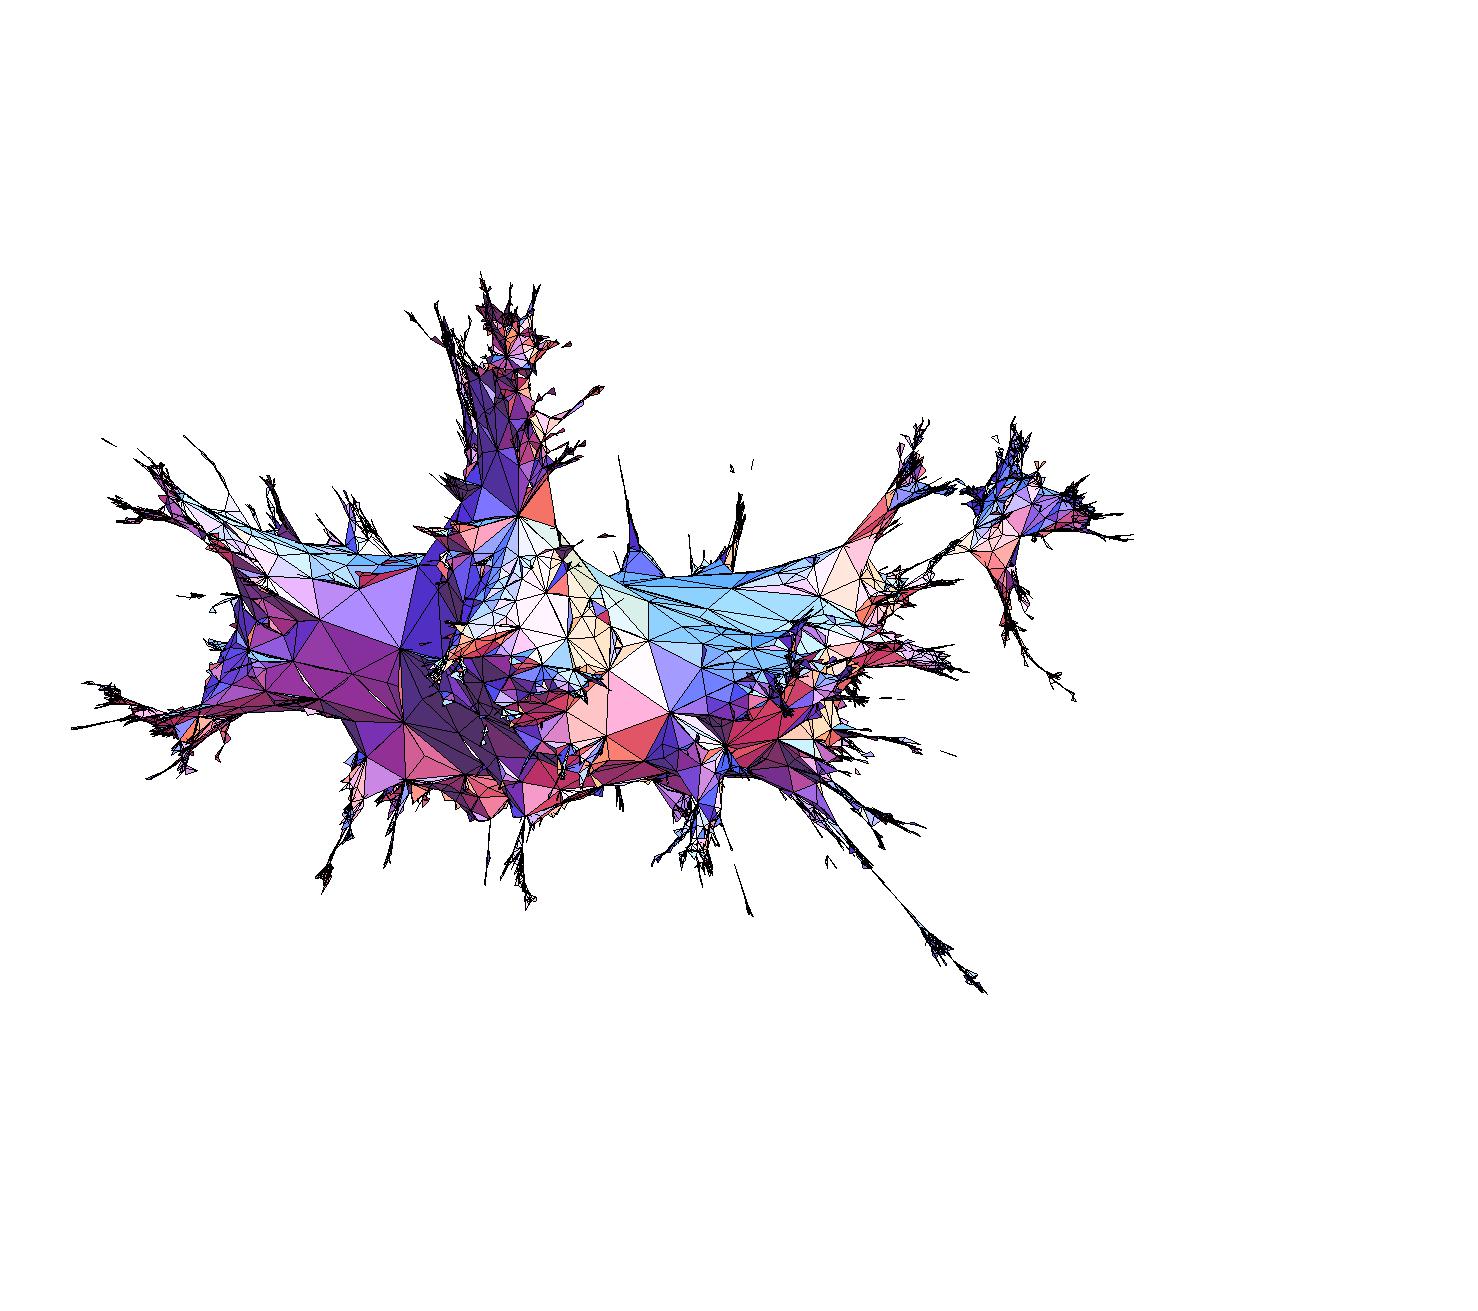
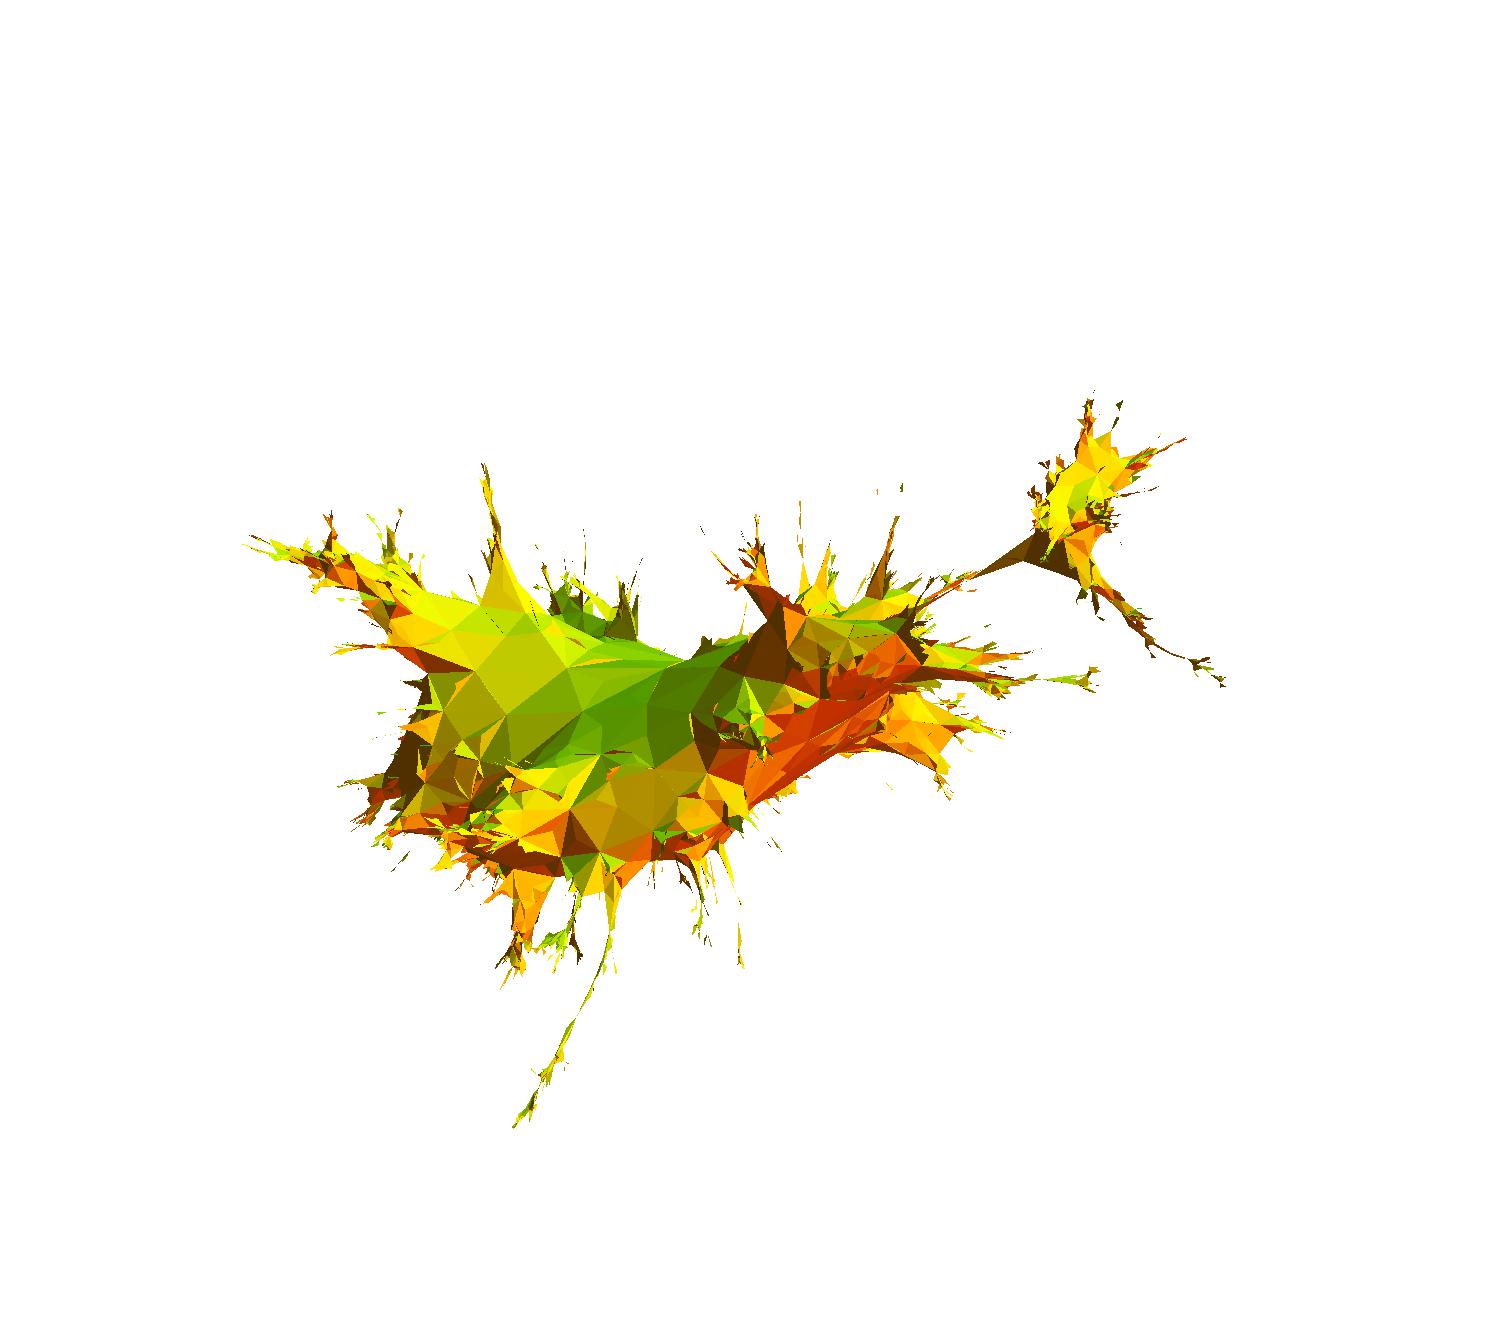
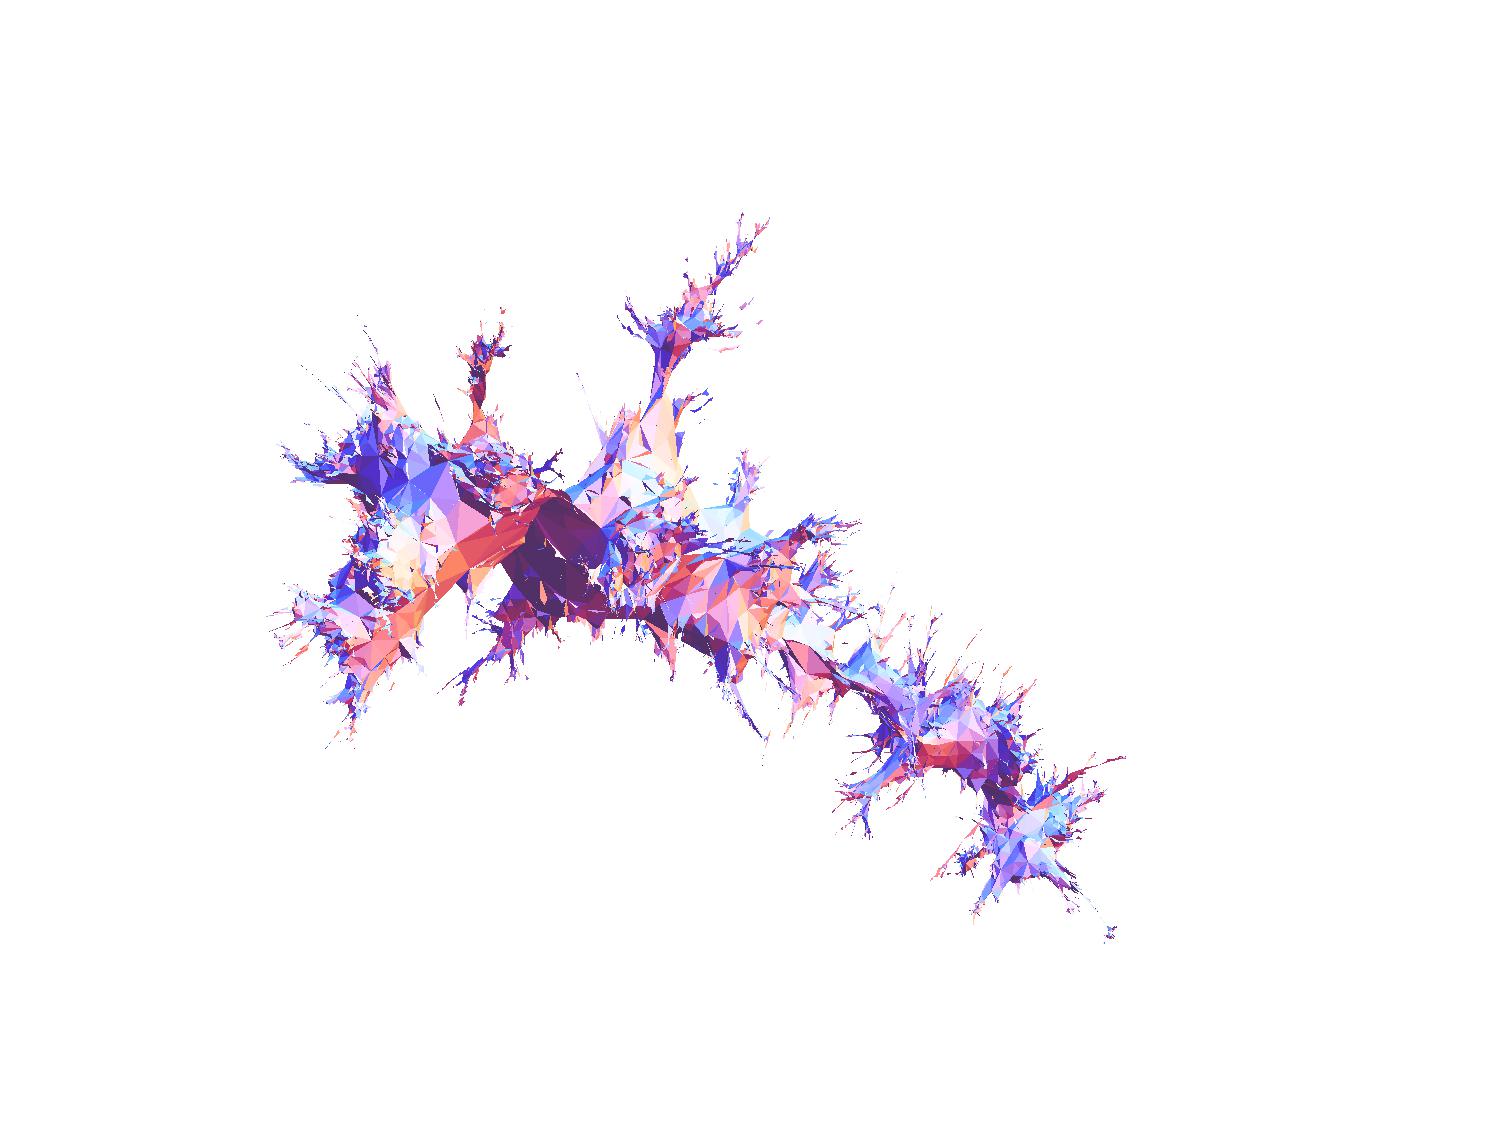
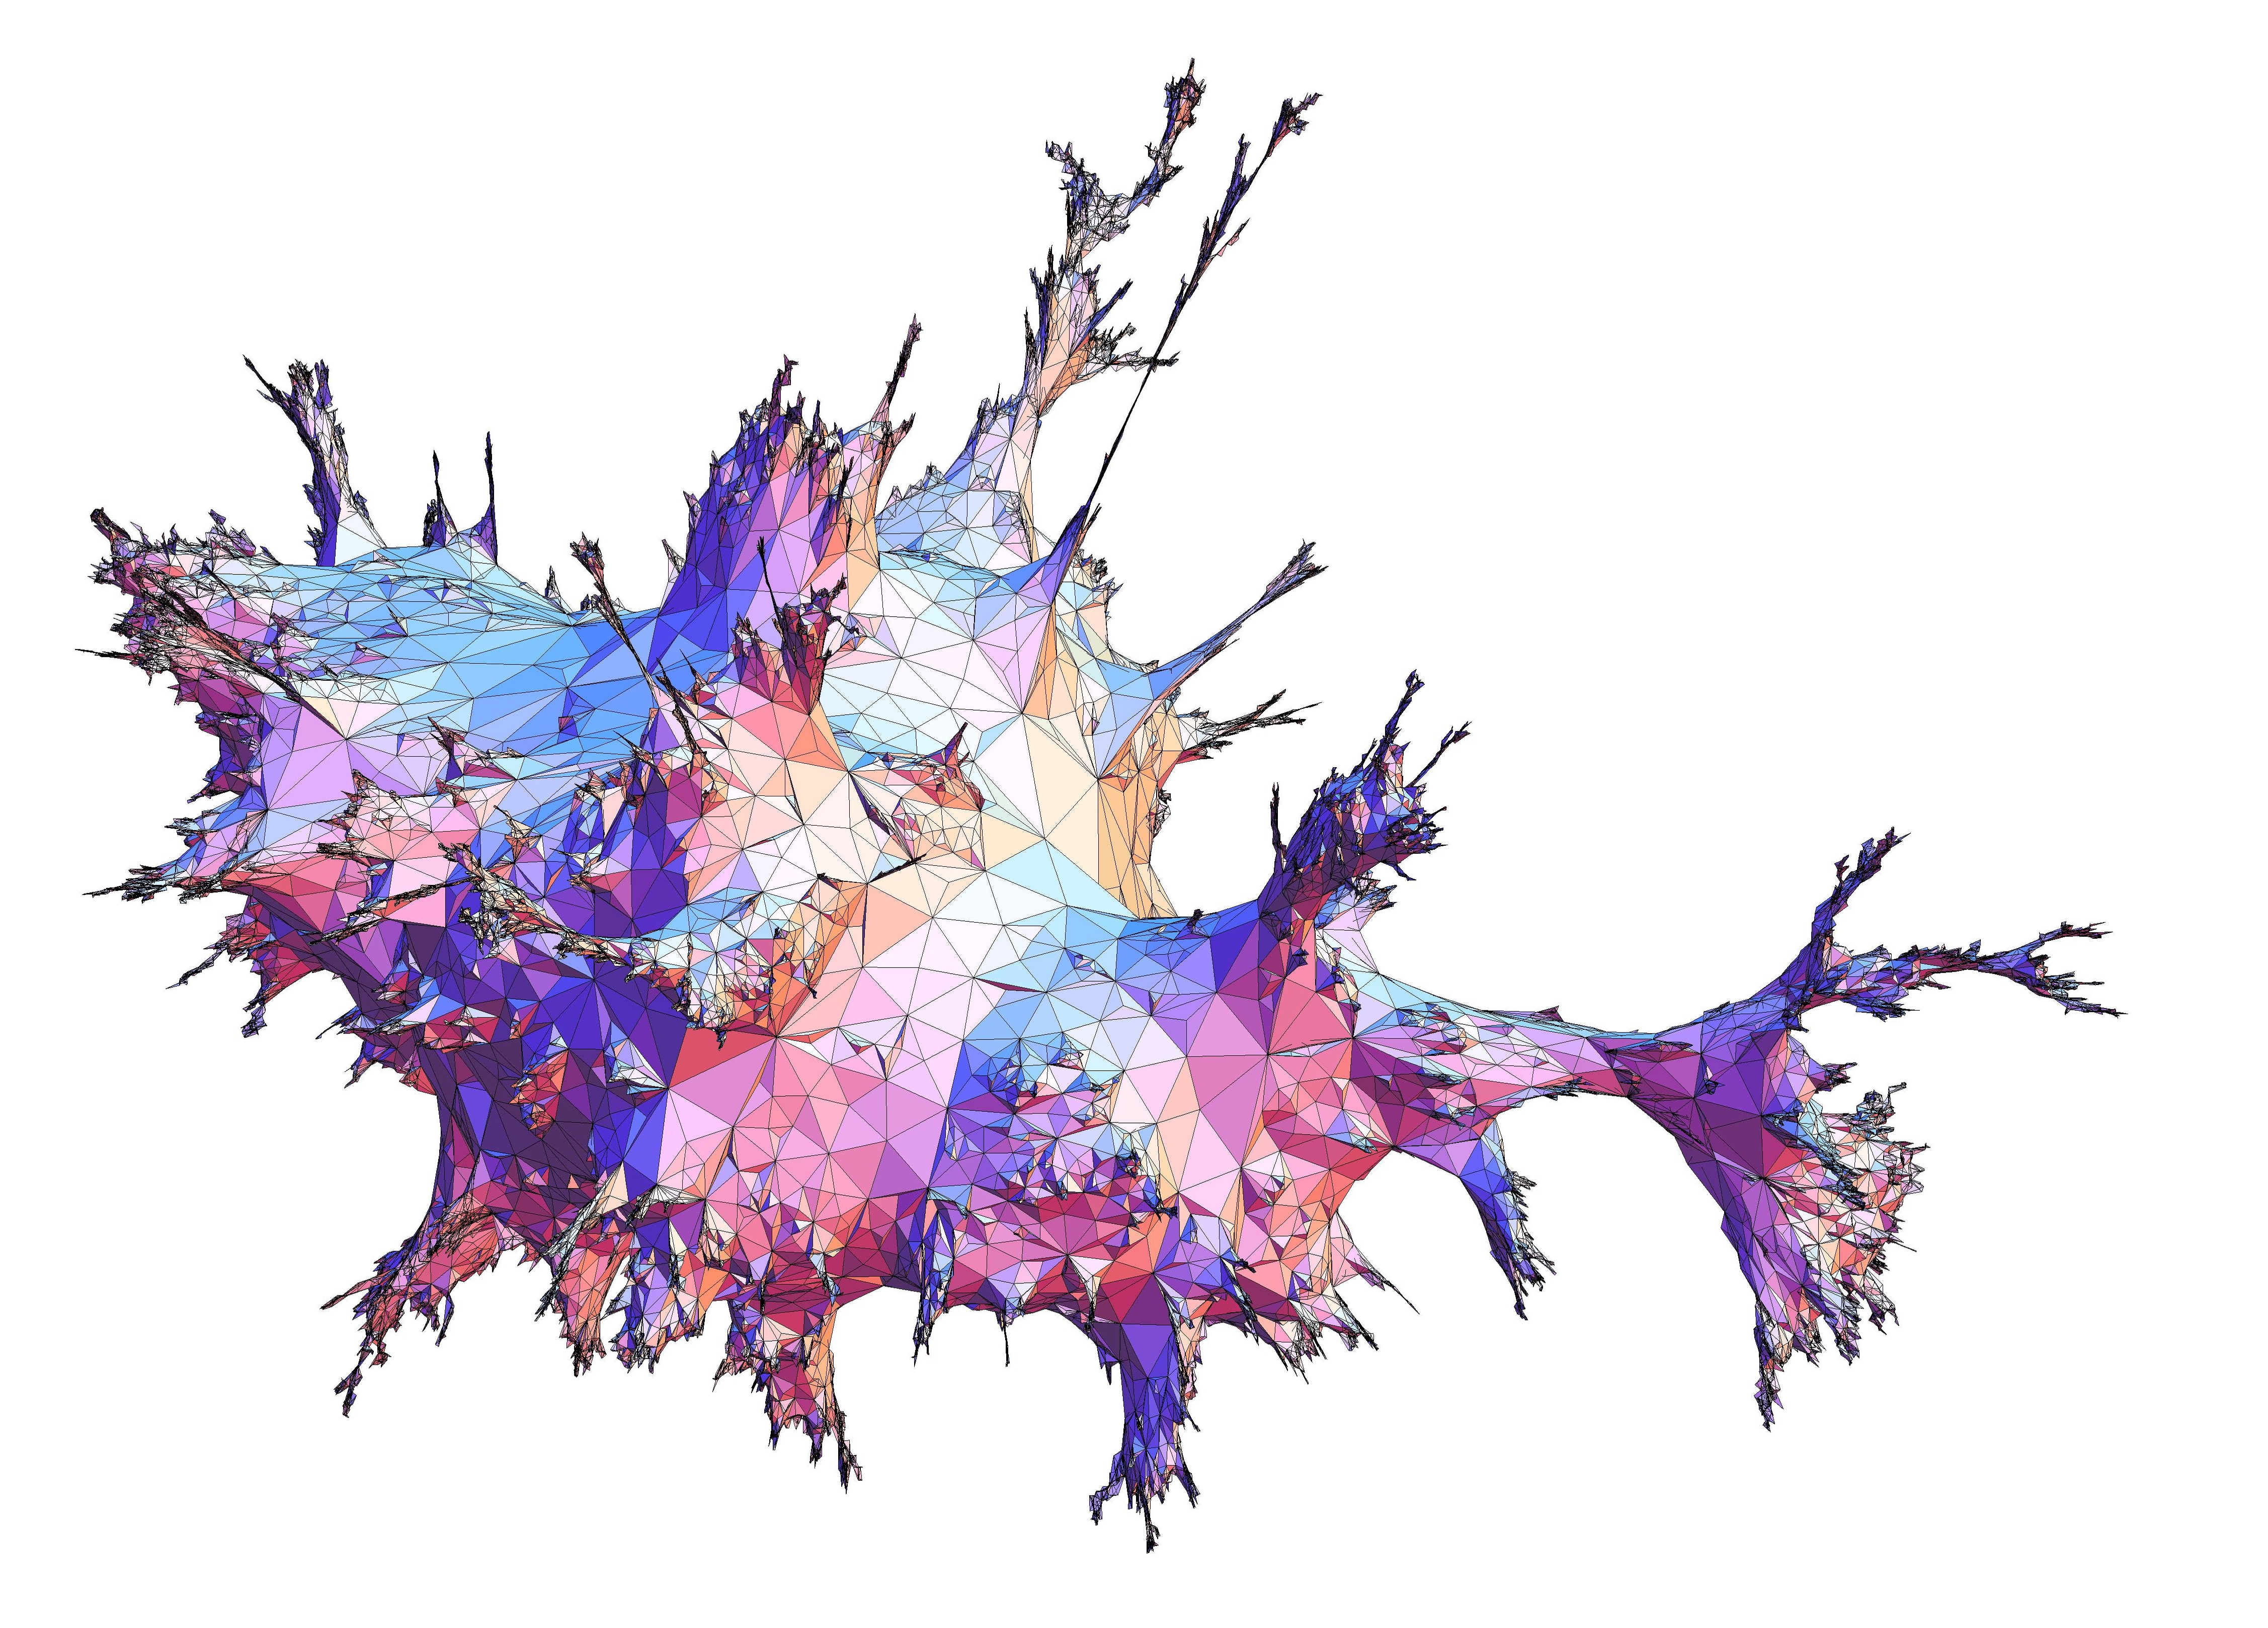
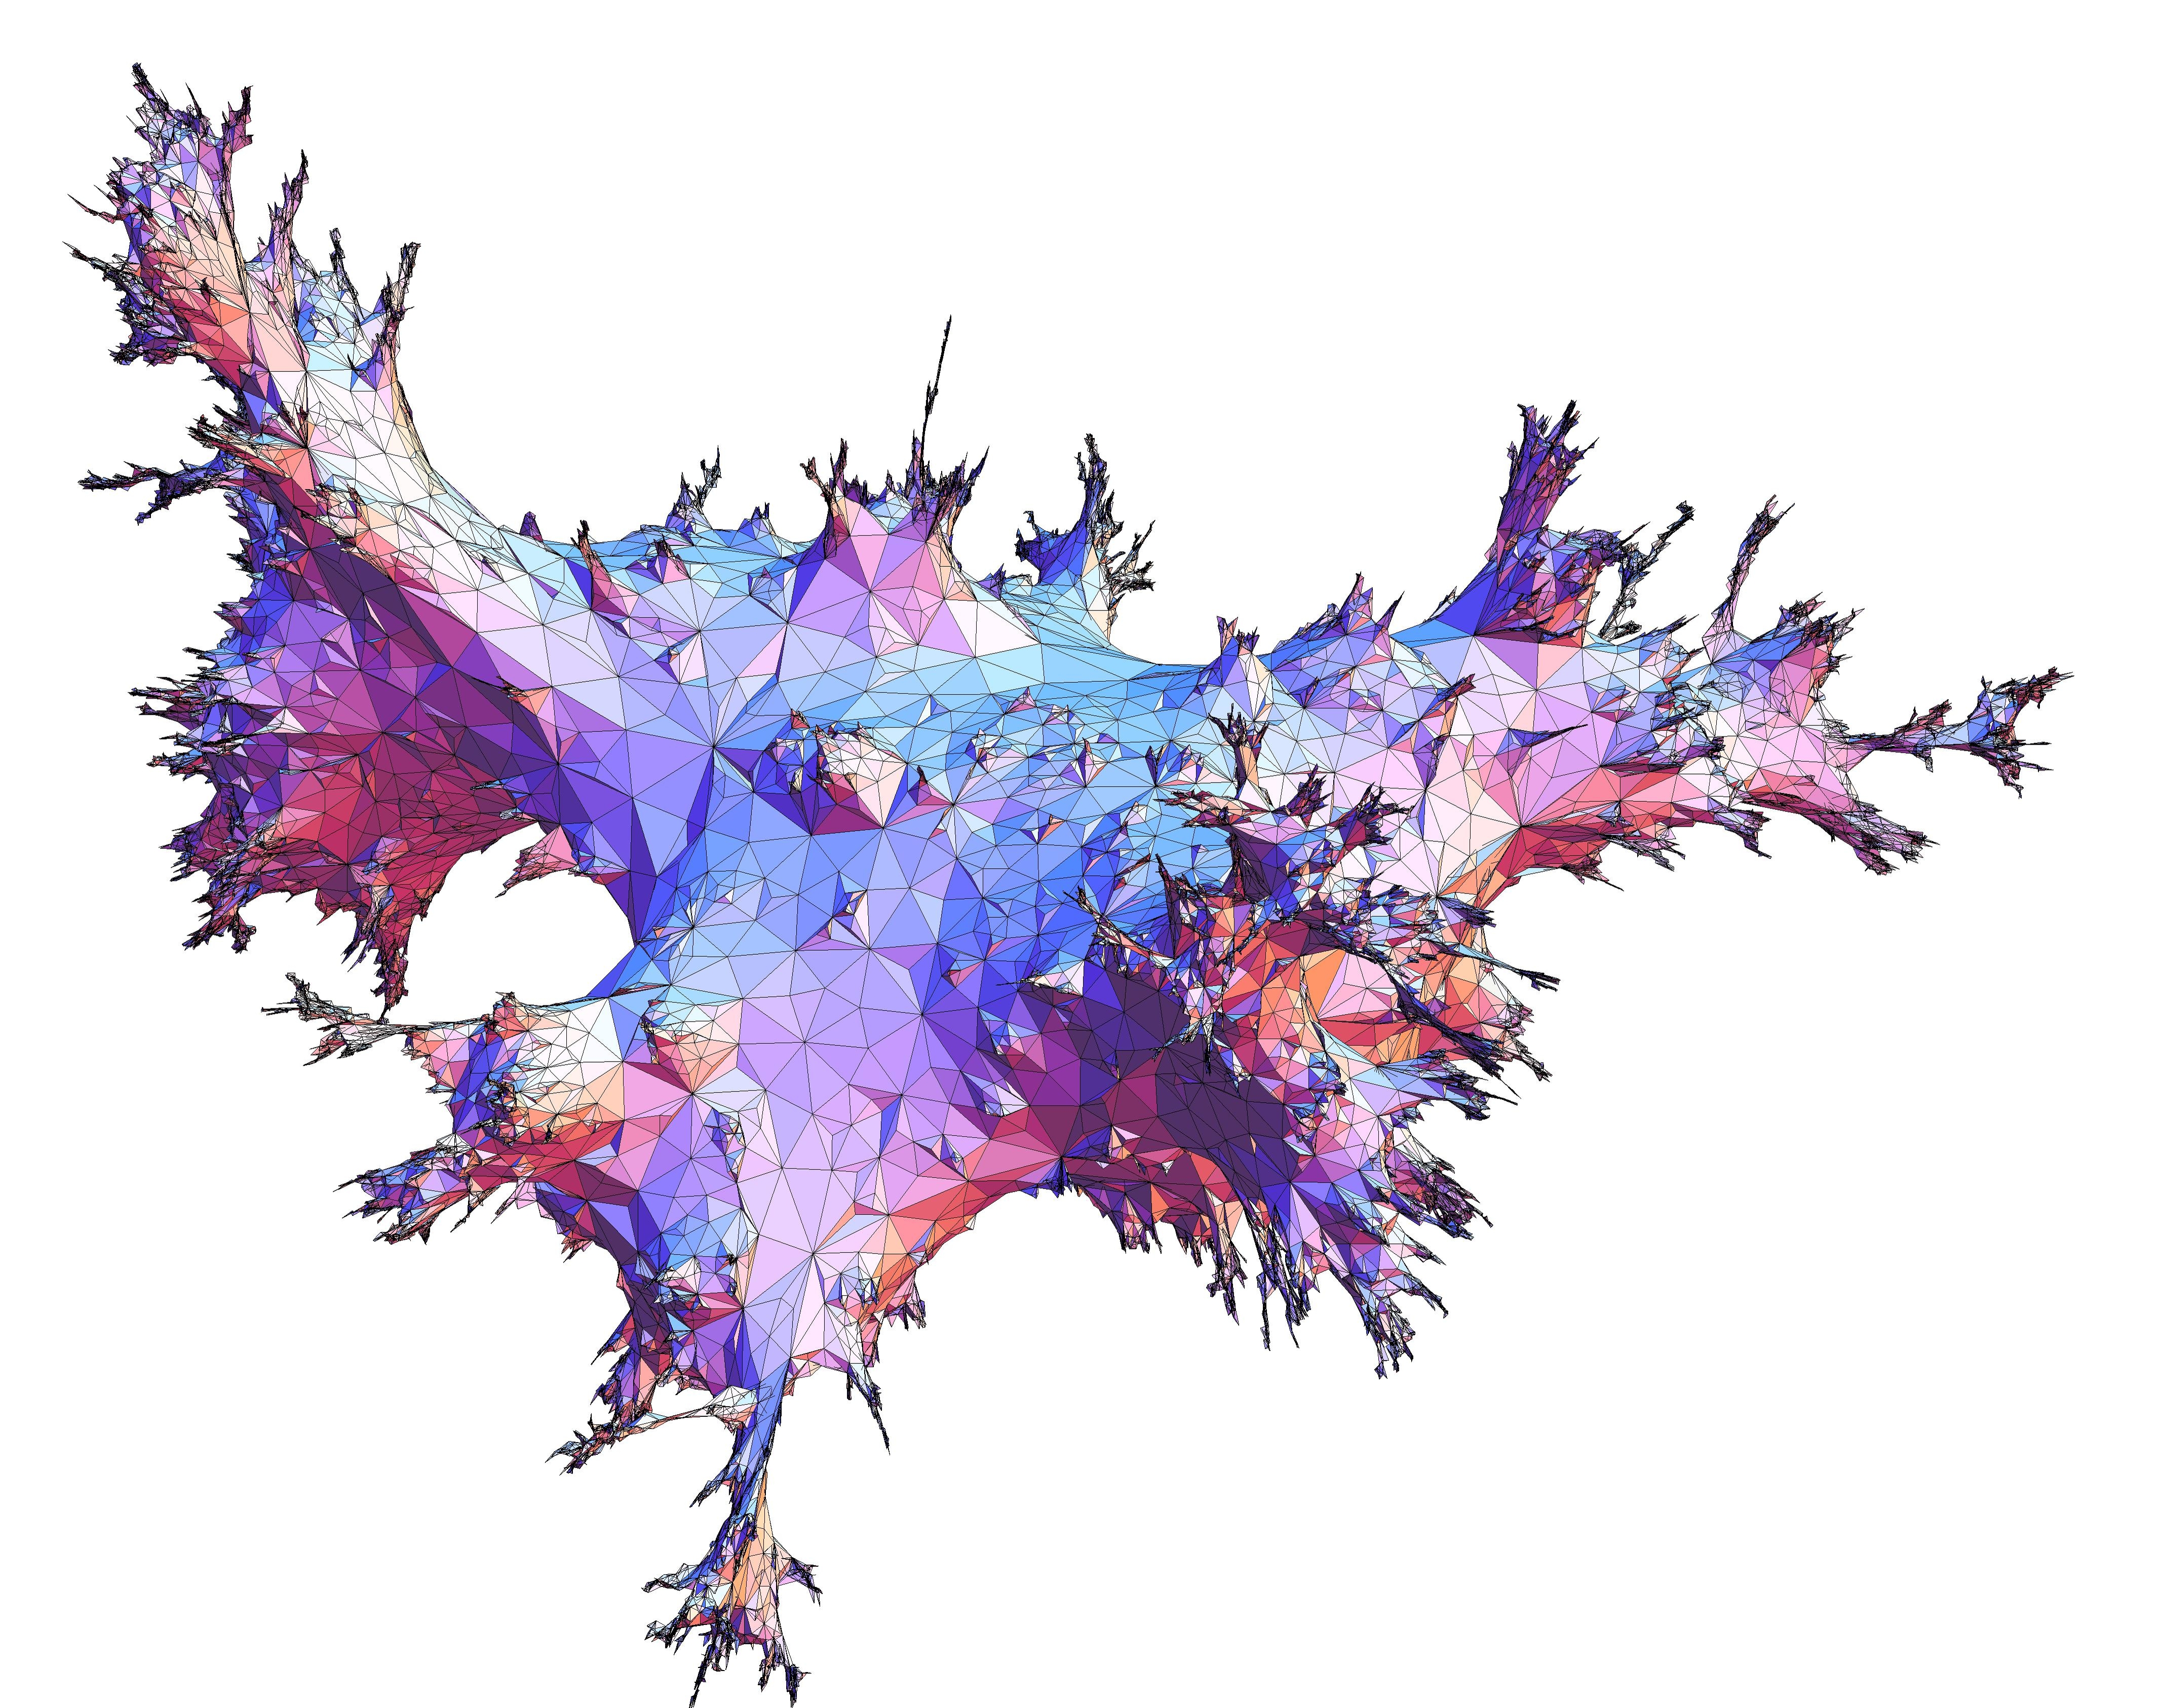
3d embeddings
These pictures represent uniform triangulations of the sphere with 10 000 vertices for the first two and between 30 000 and 40 000 for the others. The embeddings have been computed by the GraphPlot3D function of Mathematica.