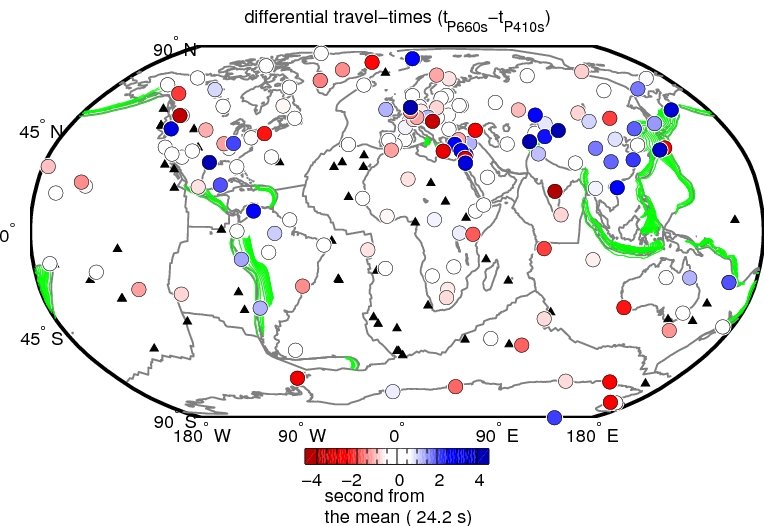
P-to-s conversions from Receiver FunctionsThis map shows the measurements of differential travel times for P-to-s converted
waves (Receiver Functions) at mantle transition zone discontinuities (Tauzin et al, 2008).
|
|||||||||||||||||||||||||||||||||||||||||||||||||||||||||||||||||||||||||||||||||||||||||||||||||||||||||||||||||||||||||||||||||||||||||||||||||||||||||||||||||||||||||||
|
For a general explanation of what is a P-to-S (Pds) receiver function, follow this link (Charles J. Ammon webpage). If you click on a station you will get for this station : a seismic section of radial receiver functions and the corresponding (tau,p) diagram. Hotspot locations from a compilation by Anderson and Schramm (2005) are shown with black triangles. Depth isolines in green indicate the top of slabs after the RUM model (Gudmundsson and Sambridge, 1998). We thank IRIS and Geoscope data centers for providing seismological data. |

| AAK | BBSR | CART | CSS | ECH | HIA | JER | KURK | MALT | NIL | PEL | PUL | SAML | SNZO | TAU | UNM | YKW3 |
| ABKT | BFO | CASY | CTAO | EFI | HKT | JOHN | KWP | MBAR | NNA | PET | QIZ | SBA | SPB | TEIG | VNDA | YSS |
| AFI | BGCA | CCM | DAG | EIL | HLG | KBS | LBTB | MBO | NOUC | PFO | QSPA | SCHQ | SSB | TIRR | VSU | |
| AIS | BGIO | CHTO | DBIC | ENH | HRV | KEV | LLLB | MDJ | NRIL | PMB | RAYN | SCZ | SSE | TIXI | WCI | |
| ALE | BILL | CMLA | DGAR | FFC | HYB | KIEV | LSA | MELI | NWAO | PMSA | RCBR | SDV | SSPA | TLY | WHY | |
| ANMO | BJI | COCO | DRLN | FRB | IBBN | KIP | LSZ | MHV | OBN | POHA | RES | SEY | STU | TRTE | WMQ | |
| ANTO | BORG | COL | DRV | FURI | INCN | KIV | LVZ | MIDW | OTAV | PPT | RGN | SFJ | SUMG | TSK | WRAB | |
| ARU | BOSA | COLA | DSB | GAR | INK | KMBO | LZH | MORC | PAB | PSZ | RPN | SFJD | SUW | TSUM | WUS | |
| ASCN | BRVK | COR | DWPF | GRFO | INU | KONO | MAHO | MPG | PAF | PTCN | RSSD | SHEL | SYO | TUC | WVT | |
| ATD | CAN | CRZF | DZM | GVD | ISP | KSDI | MAKZ | MRNI | PALK | PTGA | RUE | SNAA | TAM | ULN | YAK |