| Chapter III. LEDs Example | ||
|---|---|---|
 |  | |
| Chapter III. LEDs Example | ||
|---|---|---|
| | | |
Table of Contents
This chapter presents the LEDs (Light Emitting Diodes) example. It is a very simple application written for the WSN430 hardware platform, in which LEDs are turned on and off at variable time intervals. The purpose of this example is to show you how to execute a program using WSim, how to convert the traces generated by the simulator into a human readable format and how to debug your program using Insight/GDB.
If you are using the Worldsens Live CD, go to /opt/worldsens/examples/wsn430-leds.
If not, go to $WSIM_FOLDER/examples/wsn430-leds and type:
[wsn430-leds]$make
You should see:
msp430-gcc -mmcu=msp430x1611 -O2 -Wall -g   -c -o main.o main.c
msp430-gcc -mmcu=msp430x1611 -o wsn430-leds.elf main.o
msp430-objcopy -O ihex wsn430-leds.elf wsn430-leds.a43
msp430-objdump -dSt wsn430-leds.elf >wsn430-leds.lst
If you are not using the Worldsens Live CD and you see an error, make
sure all the tools are in your $PATH.
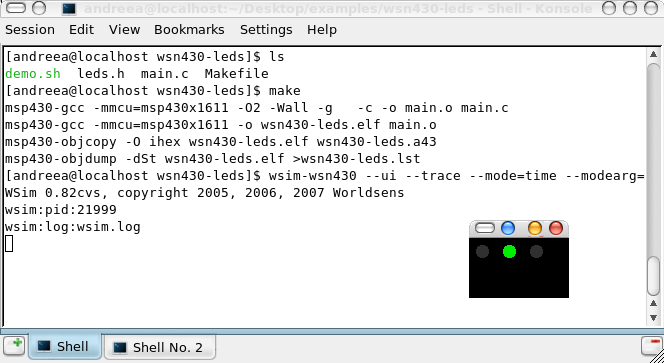
Once the example is compiled, you can execute it using WSim with the following options:
ui: to show the user interface (i.e. the LEDs blinking).trace: write simulator traces in a file (wsim.trc).mode: WSim mode (time, steps
or gdb); if this is not specified, WSim will run forever.modearg: if mode is time or steps,
then this option will specify the simulation time in nanoseconds or number of steps.The command to type is therefore the following (expected output is included below):
[wsn430-leds]$wsim-wsn430 --ui --trace --mode=time --modearg=100000000000 wsn430-leds.elfWSim 0.82cvs, copyright 2005, 2006, 2007 Worldsens wsim:pid:20530 wsim:log:wsim.log
![[Note]](admon/note.png) | The mode option |
|---|---|
As explained above, when the |
Simulation traces are written in a file called wsim.trc,
if the trace option was used. The trace file records interruptions,
blinking frequency for each of the three LEDs, clock frequencies, power mode changes,
serial port information etc. However, this information is not readily available, since it is
recorded in binary format. This is why it first needs to be converted to a human readable
form. To do so, we will use a tool called WTracer, which is part of the Worldsens tool suite.
After having executed the LEDs example, type the following:
[wsn430-leds]$wtracer --in=wsim.trc --out=wsim.gp --format=gplot
You should now have a new file, wsim.gp in Gnuplot
format. The Gnuplot utility will use this file
to generate nice plots of the recorded information (one EPS file per type of data). To do so,
type the command:
[wsn430-leds]$cat wsim.gp | gnuplot
The files resulting from this procedure are: wsim.gp.CC1100_state.eps,
wsim.gp.ds2411.eps, wsim.gp.Interrupt.eps,
wsim.gp.led1.eps, wsim.gp.led2.eps,
wsim.gp.led3.eps, wsim.gp.m25p80.eps,
wsim.gp.msp430_aclk.eps, wsim.gp.msp430_mclk.eps,
wsim.gp.msp430_smclk.eps, wsim.gp.Power_mode.eps,
wsim.gp.Usart0.eps, wsim.gp.Usart1.eps.
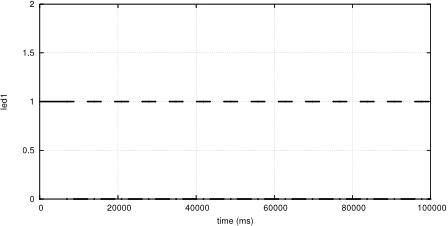
However, since this simple example only makes use of LEDs, the LED files are the only ones relevant.
They show the LED blinking frequency during the entire simultation time. The file for LED 1 is
included below, in Figure III.2, “Trace of LED 1”.
WSim understands the GDB remote protocol to drive the simulation engine. The
simulator can be started using the --mode=gdb parameter to
use this functionality. The following steps should be followed in order to debug an application
using WSim and Insight/GDB:
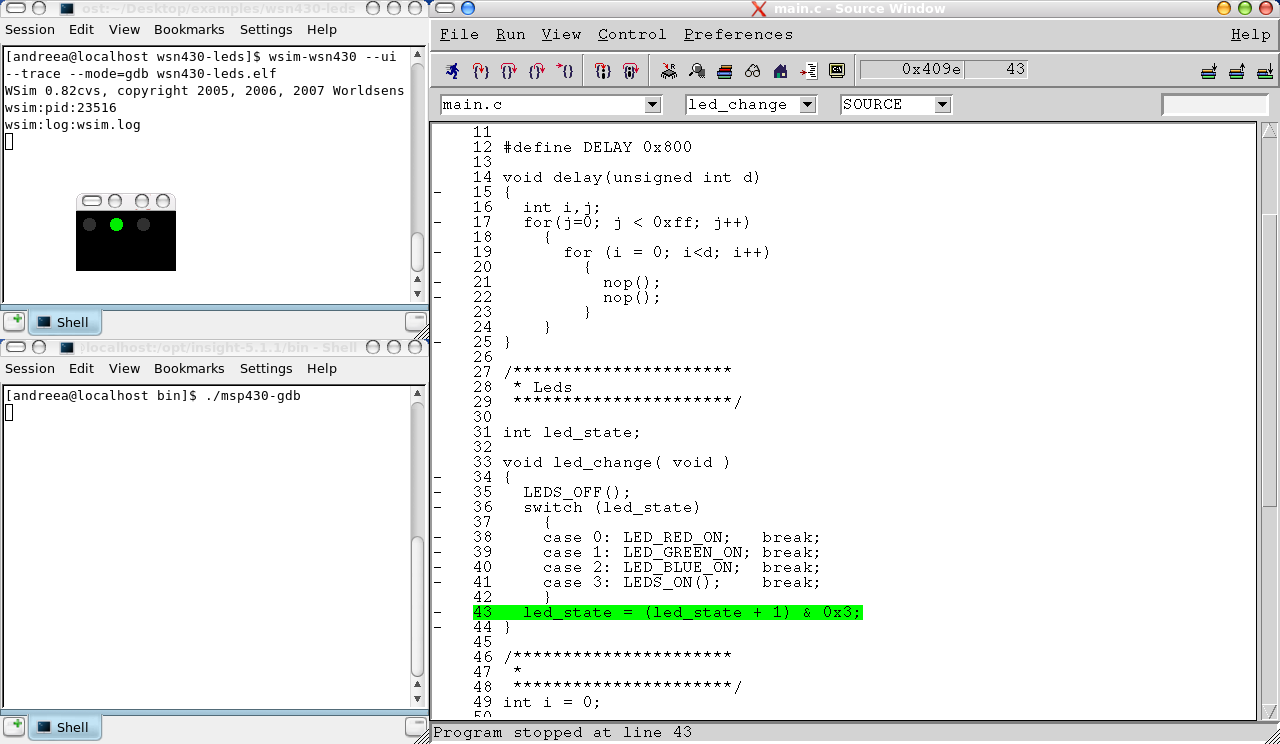
Start a simulation in debug mode. WSim will stop right after machine creation and will wait on the default port (TCP 2159) until a connexion is made from a remote debugger that implements the same target architecture (GDB must be compiled as a cross-debugger for the target architecture):
[wsn430-leds]$wsim-wsn430 --ui --trace --mode=gdb wsn430-leds.elf
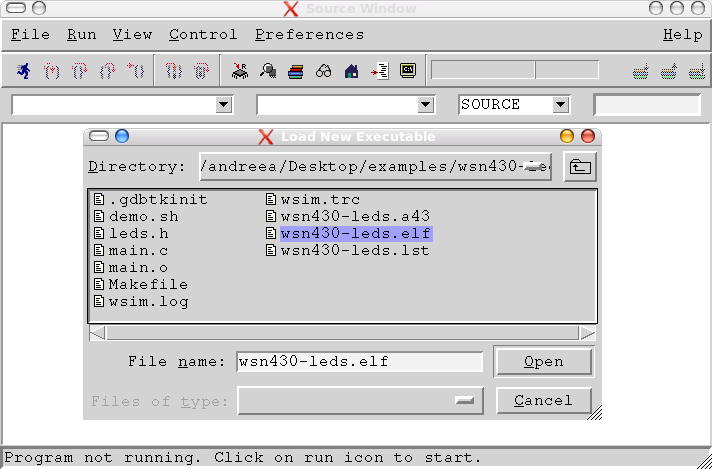
Launch Insight/GDB and load the ELF file as shown below (File menu --> Open):
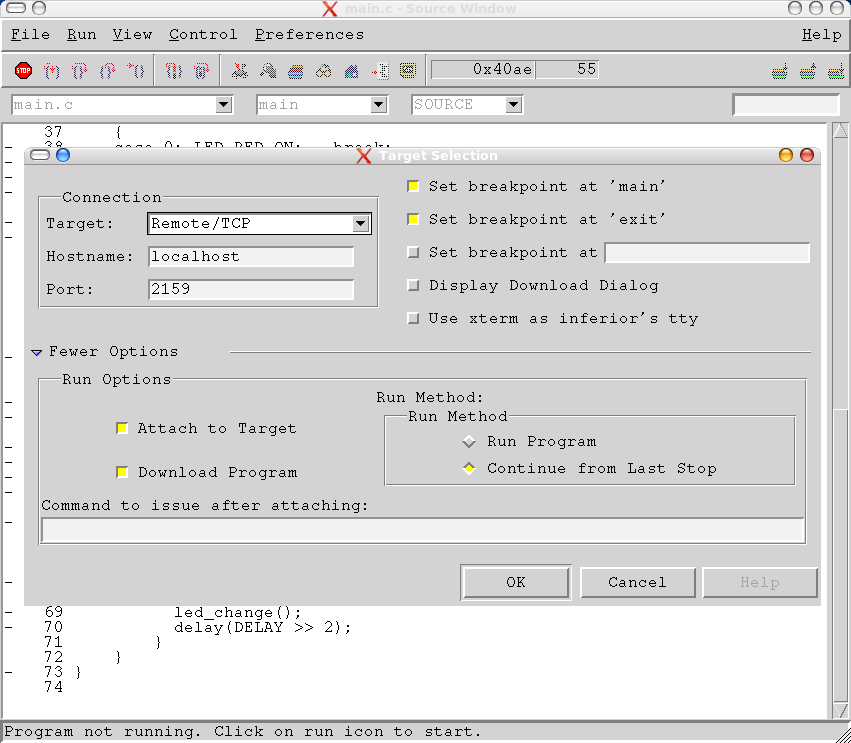
Connect to the WSim simulation as shown below (Run menu --> Connect to target):
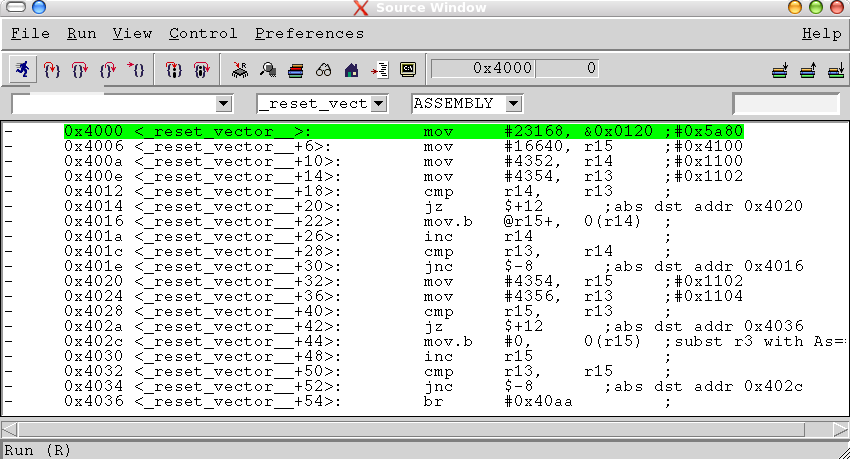
Once you click OK, you should see the following:
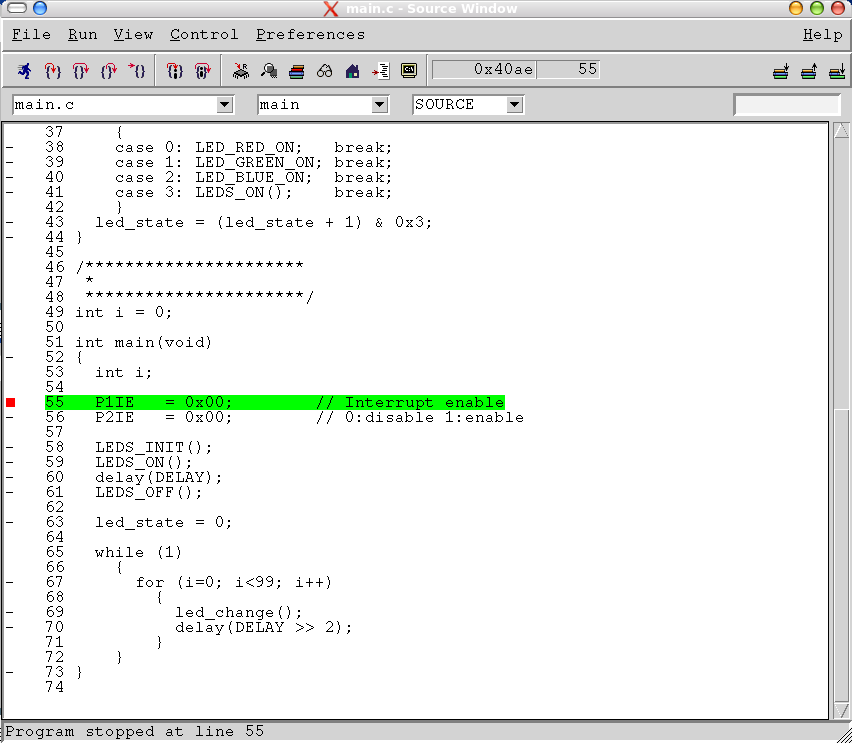
Start the execution by pressing the « Run » button (upper left corner). Don't worry about breakpoints, two of them are automatically set for you: one in the beginning of the main function and a second one at the end of the function. You should see this:
Now you can start setting your breakpoints and debugging!
Stop debugging and close the file: File menu --> Close.
| | | |
| Chapter II. Brief Presentation of the Tools |  | Chapter IV. Timer Example |