Atmospheric turbulence
Thesis 1/2
This figure illustrates a numerical simulation of turbulence in a portion of a stratified atmosphere. The simulation begins with an atmosphere at rest. A faint stochastic force, driven by an Ornstein-Uhlenbeck process, mimics the sources of turbulence; the atmosphere then starts to move by large bulks. Friction between bulks triggers the well-known turbulence cascade, while stratification limits the vertical expansion of the turbulent structures. After some time, the flow converges to a permanent stochastic state. This state is maintained as long as forcing continues. The figure shows turbulent structures of the permanent state for two intensities of forcing, that are representative of weak and mild levels of turbulence.
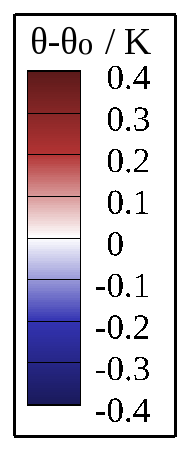
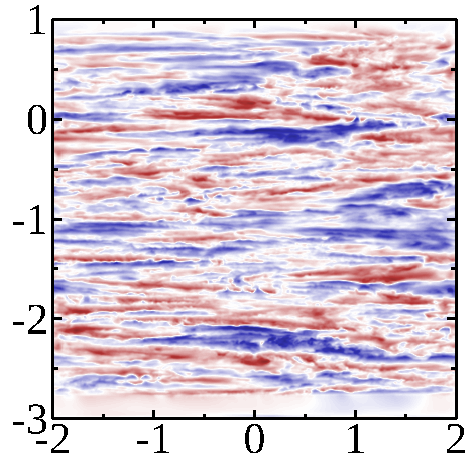
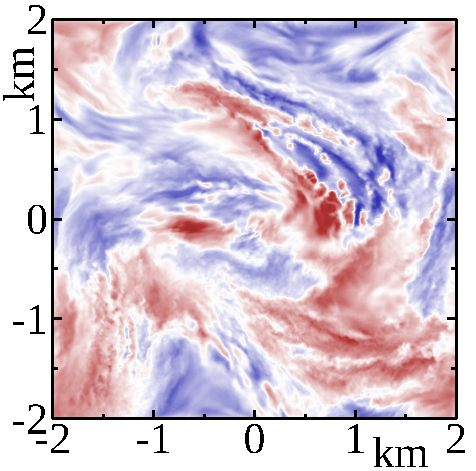
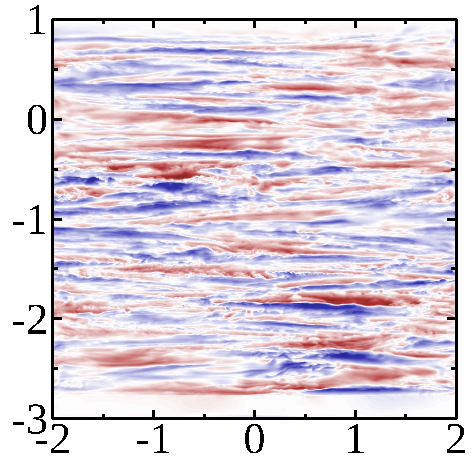
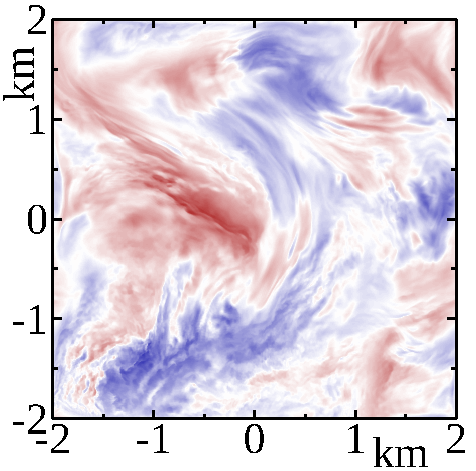
The layered structures are clearly visible on the vertical profiles, on the top. With stronger levels, turbulent structures are smaller.
Ice crystals in an aircraft wake
Thesis 2/2
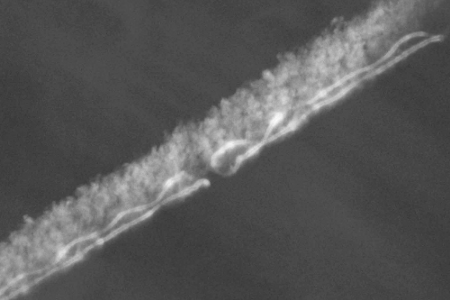
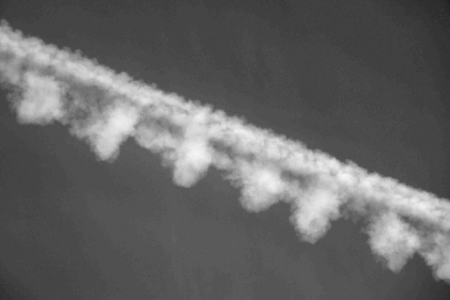
This figure illustrates effects of atmospheric turbulence in the distribution of ice crystals in the wake of an aircraft. The wake is represented by a pair of counter-rotating vortices laden with Lagrangian particles. The wake pair shall develop Crow instabilities until collision and release of the crystals. Instabilities was originally triggered by a sine wave, but is now replaced by an atmospheric turbulence field (see figure above). The figure compare the two triggering of instabilities, and compares to photographies of actual wakes of age corresponding to the end of the simulation.
Immersed boundary conditions & Lascaux caves
Postoc at I2M 1/2
The immersed boundary method is a technique to represent arbitrary boundaries in flow field simulations carried on Cartesian grids.
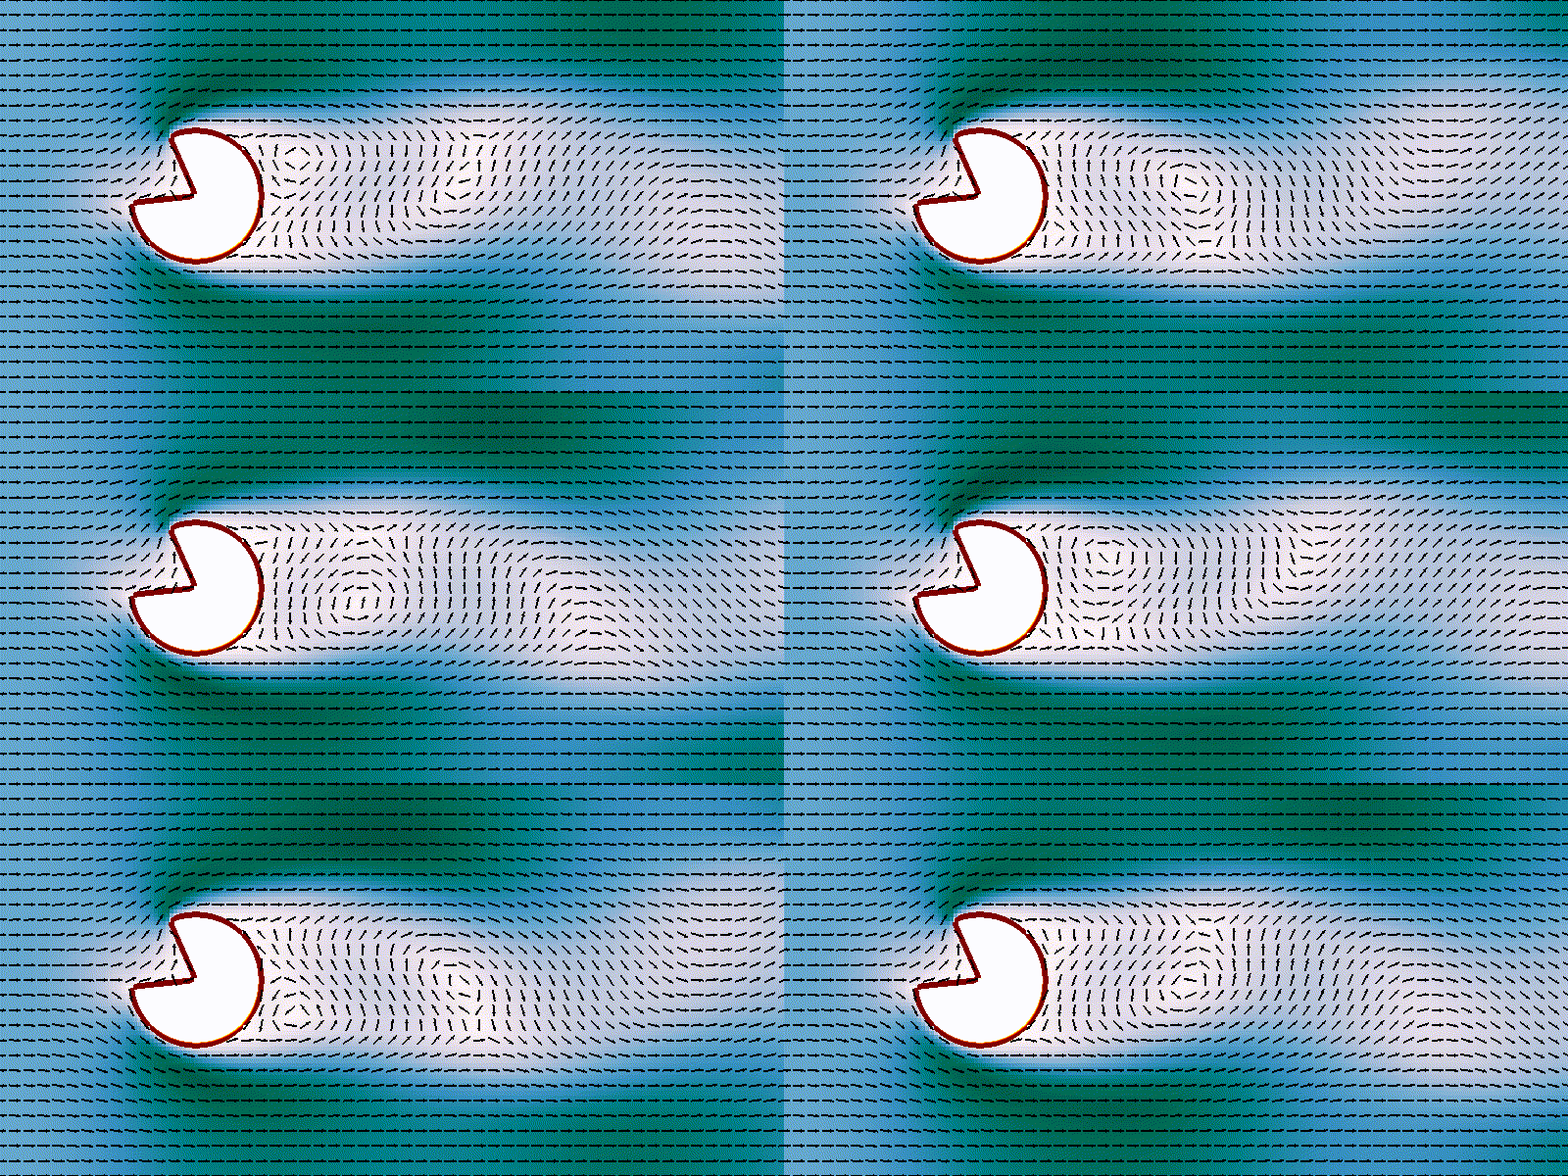
Such technique is adapted to intricate boundaries of the Lascaux caves. As show below, the very complex and intricate boundary of the cave makes it very difficult to generate body-fitted grids.
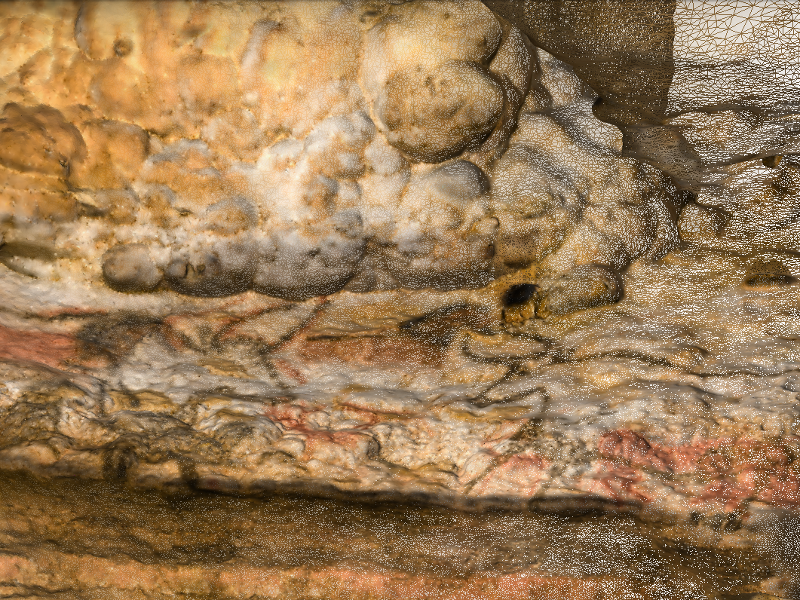
The large and complex geometry of the Lascaux caves makes these simulation very challenging. Pictures below show a preliminary simulation of convection in the Lascaux caves, using 1st-order accurate methods.
Phase change — Apparent Heat Method
Postoc at I2M 2/2
Here we compute the melting of salt in a graphite cavity: bottom and top boundaries are set to 1300 K and 1000 K, respectively; the salt melting point is at 1121 K.
We use the Apparent Heat Capacity Method: enthalpy is the primary variable, from which we deduce phase and temperature. Enthalpy's pde has no discontinuities as in phase and temperature fields. The method converges towards the appropriate stationary state, but realism of intermediate state (solid-liquid interface) is not guaranteed.
The figure bellow illustrates salt melting inside a graphite cavity heated from below. The imperfect contact between salt and graphite is modeled by a surface resistance, whose effect is rendered by a discontinuity at the interface. The heat diffuse much more quickly in graphite than in salt, this is a desirable property of the device. Some numerical effects are clearly seen at the early stages of melting, although the computation does not crash and evolves towards a better state.