braidHymo package
braidHymo.RmdData format
One type (1 x rivdata) or two types of files (n x rivdata + rivers) must be provided: see details below.
File rivdata
There must be as many rivdata files as there are rivers considered.
One rivdata file corresponds to
- 1 row per sampling point with altitude measurement
-
multiple columns, 2 of which are non-optional and should correspond to:
- a cross-section ID for the point (typically named
ID) - an altitude measure for the point (typically named
RASTERVALU)
- a cross-section ID for the point (typically named
Files rivers (optional)
To calculate the indices on multiple rivers, a table rivers containing information about the rivers should be provided.
The table should contain
-
n rows (as many as there are
rivdatafilepaths) -
multiple columns, 3 of which are non-optional and should correspond to:
- the catchment area in km² (typically named
area) - the space between points on each transect in m (typically named
points_space) - the path to corresponding
rivdatafilepath (typically namedfilepath)
- the catchment area in km² (typically named
Other columns might refer to e.g. river name, year, etc.
rivers=readr::read_csv("../data-raw/rivers.csv") %>%
    mutate(filepath=paste0("../data-raw/",filepath)) %>%
    mutate(year=as.factor(year))
#> Rows: 2 Columns: 6
#> ── Column specification ────────────────────────────────────────────────────────
#> Delimiter: ","
#> chr (3): river, reach, filepath
#> dbl (3): year, area, points_space
#>
#> ℹ Use `spec()` to retrieve the full column specification for this data.
#> ℹ Specify the column types or set `show_col_types = FALSE` to quiet this message.

# Display the resulting table:
rivers
#> # A tibble: 2 × 6
#>   river   reach     year   area points_space filepath
#>   <chr>   <chr>     <fct> <dbl>        <dbl> <chr>
#> 1 Drac    Chabottes 2018    253            1 ../data-raw/Drac_Chabottes_2018.txt
#> 2 Durance Brillanne 2017   7850            1 ../data-raw/Durance_Brillanne_2017…
One river: apply braidHymo_one()
First, read and clean rivdata with braidHymo_read()
data_Drac=braidHymo_read("../data-raw/Drac_Chabottes_2018.txt")

# Display the first lines of the resulting table:
head(data_Drac)
#> # A tibble: 6 × 2
#>   ID_XS     Z
#>   <int> <dbl>
#> 1   232 1030.
#> 2   231 1030.
#> 3   231 1030.
#> 4   231 1030.
#> 5   231 1030.
#> 6   231 1030.
Then, calculate indices for this river with braidHymo_one():
result_Drac=braidHymo_one(data_Drac,
                          area=253,
                          points_space=1)
#> Warning in braidHymo_one(data_Drac, area = 253, points_space = 1): The cross-
#> sections with ID 232 contain only one measure.

# Display the first lines of the resulting table:
head(result_Drac)
#> # A tibble: 6 × 6
#>   Nb_mean_meas XS_onlyone variable type  stat    value
#>          <dbl>      <dbl> <chr>    <chr> <chr>   <dbl>
#> 1         109.      0.431 BRI_mean BRI*  mean  0.00347
#> 2         109.      0.431 BRI_SD   BRI*  SD    0.00187
#> 3         109.      0.431 BRI_min  BRI*  min   0.00114
#> 4         109.      0.431 BRI_max  BRI*  max   0.0136
#> 5         109.      0.431 W_mean   W*    mean  9.50
#> 6         109.      0.431 W_SD     W*    SD    2.71
Multiple rivers: apply braidHymo()
Here, we generalise this to 2 rivers.
The function braidHymo() retrieves from table rivers all the necessary information about rivers, and paths to rivdata filepaths.
result=braidHymo(rivers)
#> Warning in .f(rivdata = .l[[1L]][[i]], area = .l[[2L]][[i]], points_space
#> = .l[[3L]][[i]], : The cross-sections with ID 232 contain only one measure.

# Display the first lines of the resulting table:
head(result)
#> # A tibble: 6 × 12
#>   river reach year   area points_space filepath Nb_mean_meas XS_onlyone variable
#>   <chr> <chr> <fct> <dbl>        <dbl> <chr>           <dbl>      <dbl> <chr>
#> 1 Drac  Chab… 2018    253            1 ../data…         109.      0.431 BRI_mean
#> 2 Drac  Chab… 2018    253            1 ../data…         109.      0.431 BRI_SD
#> 3 Drac  Chab… 2018    253            1 ../data…         109.      0.431 BRI_min
#> 4 Drac  Chab… 2018    253            1 ../data…         109.      0.431 BRI_max
#> 5 Drac  Chab… 2018    253            1 ../data…         109.      0.431 W_mean
#> 6 Drac  Chab… 2018    253            1 ../data…         109.      0.431 W_SD
#> # … with 3 more variables: type <chr>, stat <chr>, value <dbl>
It is then possible to graphically display the results for these rivers using function braidHymo_plot():
braidHymo_plot(result,index="BRI*", position=year, color=river)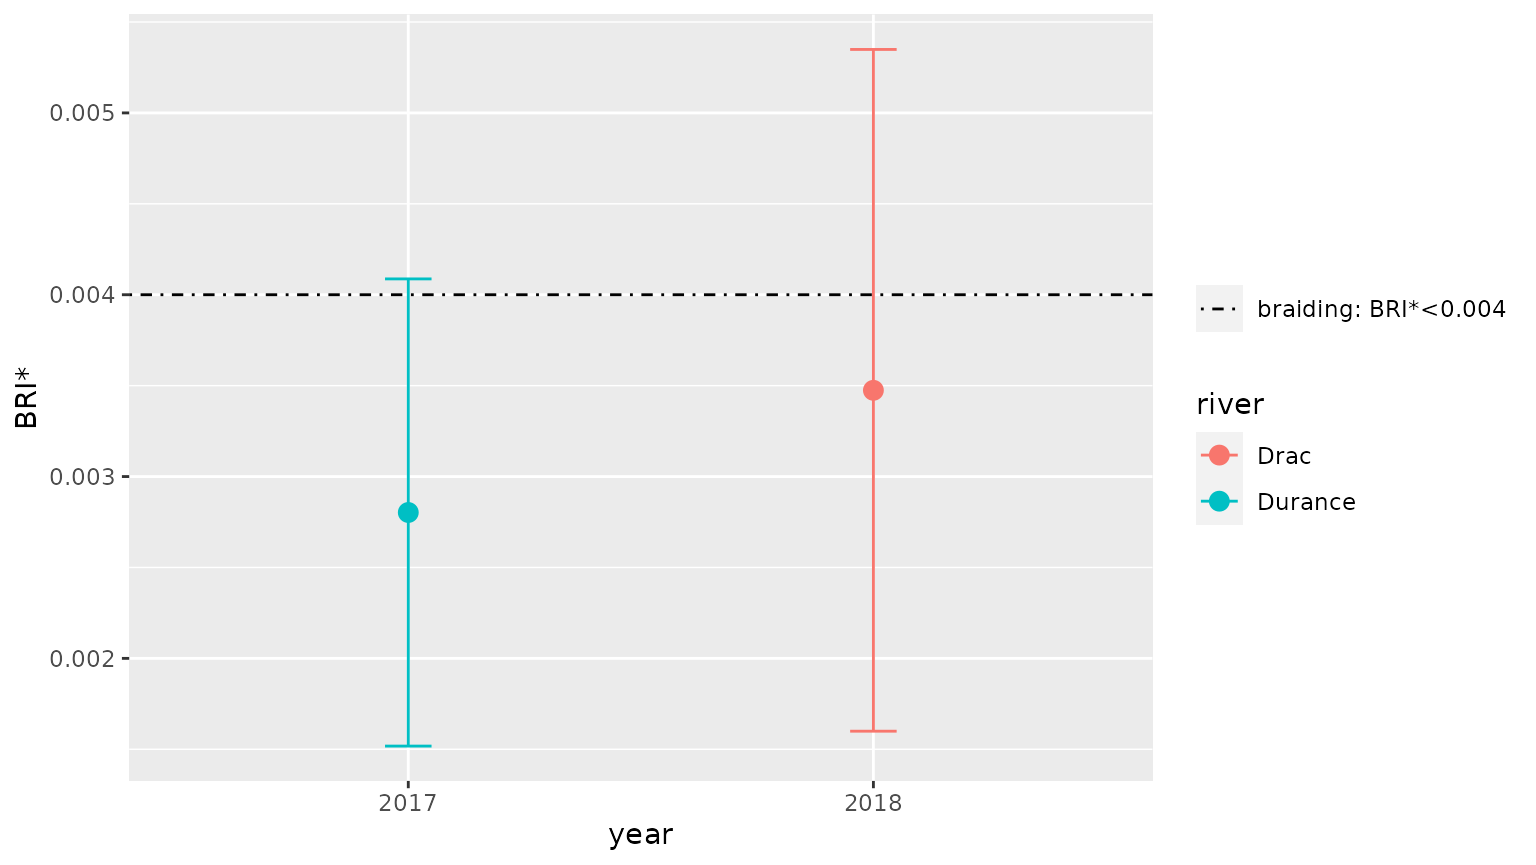
braidHymo_plot(result,index="W*", position=year, color=river)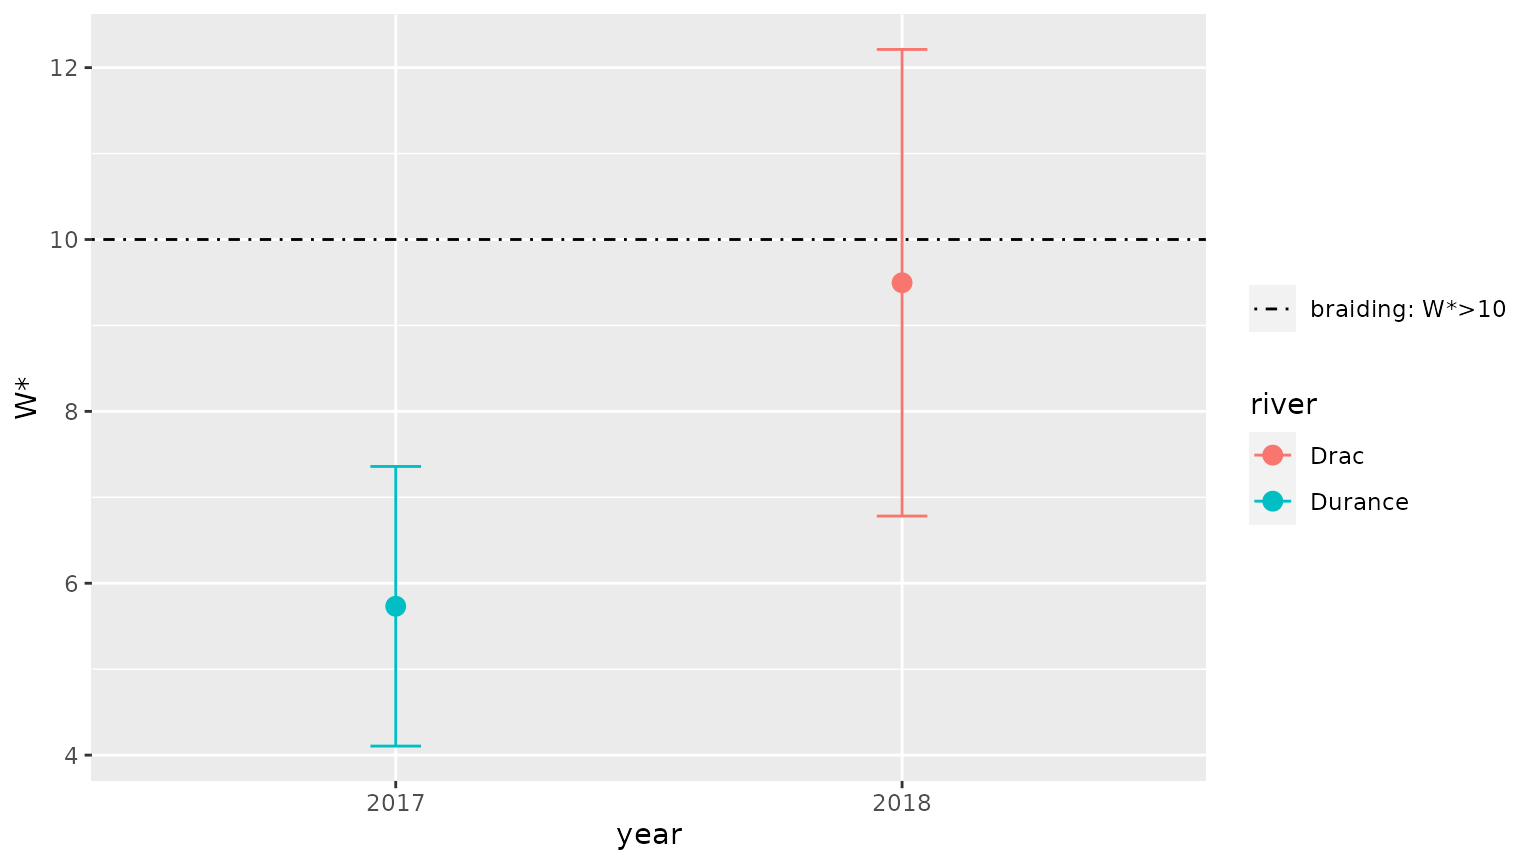
References
When using this package, please refer to Devreux et al. (2021).
Devreux, Lise, Lise Vaudor, Sandrine Lallias-Tacon, Barbara Belletti, Mathieu Cassel, Frédéric Liébault, and Margot Chapuis. 2021. braidHymo: Morphometric indices for braided rivers. (version v1.0.0). Zenodo. https://doi.org/10.5281/zenodo.5796184.
Liébault, F., S. Lallias‐Tacon, M. Cassel, and N. Talaska. 2013. “Long Profile Responses of Alpine Braided Rivers in SE France.” River Research and Applications 29 (10): 1253–66. https://doi.org/10.1002/rra.2615.
Piégay, Hervé, Adrien Alber, Louise Slater, and Laurent Bourdin. 2009. “Census and Typology of Braided Rivers in the French Alps.” Aquatic Sciences 71 (3): 371–88. https://doi.org/10.1007/s00027-009-9220-4.
Terrier, Benoît, Hervé Piégay, Frédéric Liébault, Simon Dufour, Barbara Belletti, Yves-François Le Lay, Pierre Marmonier, et al. 2019. “Les Rivières En Tresses - Eléments de Connaissance.” Guide. Agence de l’eau Rhône Méditerranée Corse.