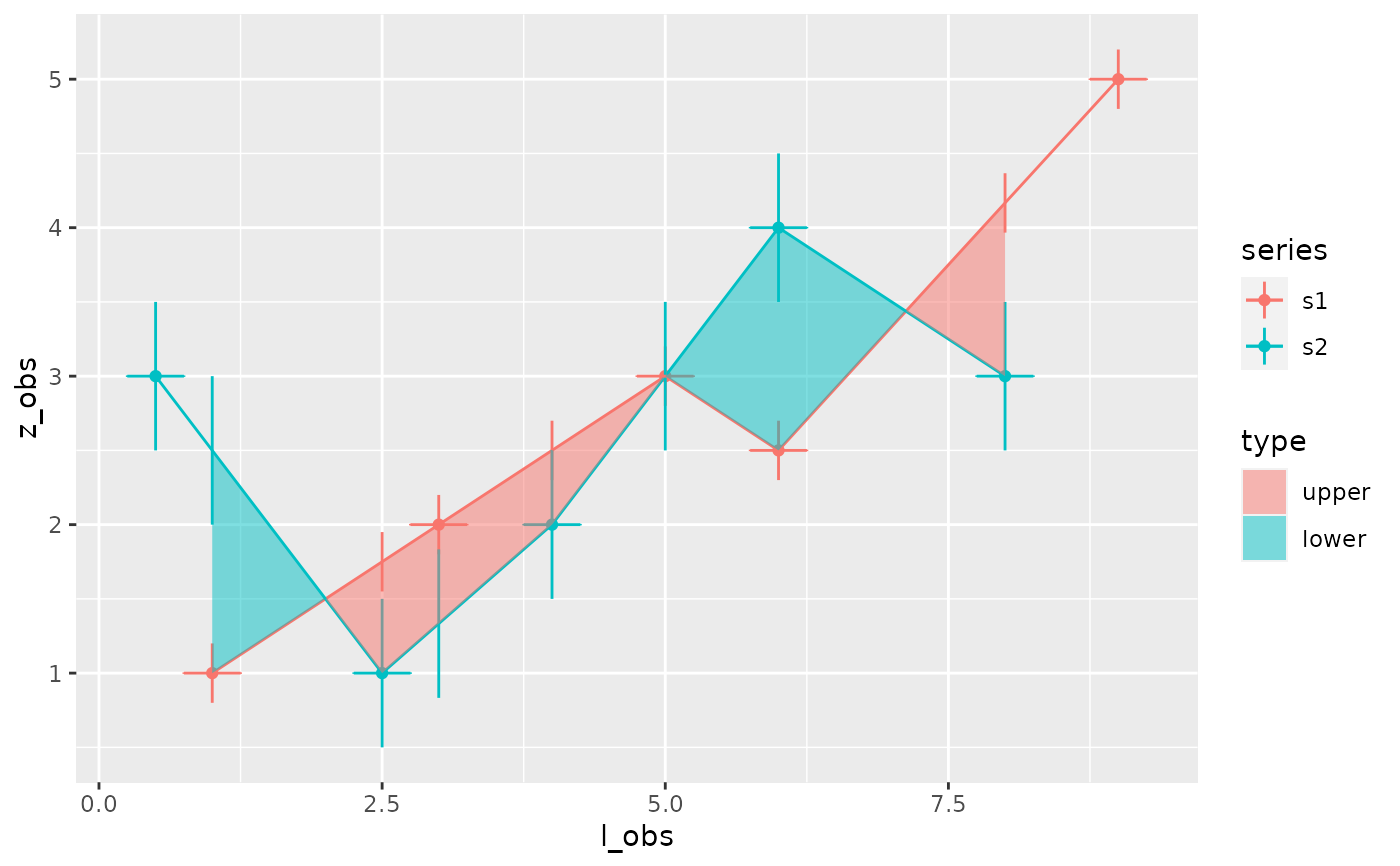
A function to plot the area between two profiles
plot_area.RdThis function takes as input the result of function area_between()
plot_area(result_area, distinguish_type = TRUE, show_uncertainty = FALSE)
Arguments
| result_area | the result of function area_between() or area_uncertainty() |
|---|---|
| distinguish_type | whether or not to distinguish between upper area and lower area |
| show_uncertainty | whether or not to show the sources of error |
Value
a plot showing the area difference between series
Examples
s1=tibble::tibble(l=c(1,3,5,6,9),z=c(1,2,3,2.5,5)) s2=tibble::tibble(l=c(0.5,2.5,4,6,8),z=c(3,1,2,4,3)) result_area <- area_between(s1,s2,sigma_z=c(0.2,0.5),sigma_l=c(0.25,0.25)) plot_area(result_area, show_uncertainty=TRUE)#> Warning: Ignoring unknown aesthetics: x#> Warning: Removed 6 rows containing missing values (geom_point).#> Warning: Removed 6 row(s) containing missing values (geom_path).#> Warning: Removed 10 rows containing missing values (geom_segment).#> Warning: Removed 16 rows containing missing values (geom_errorbarh).