riverbed
riverbed.Rmd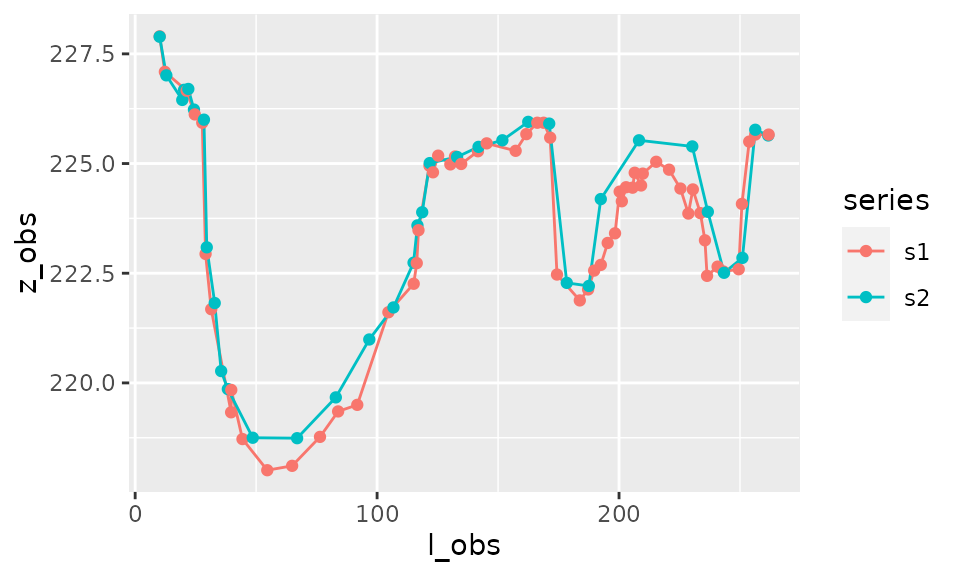
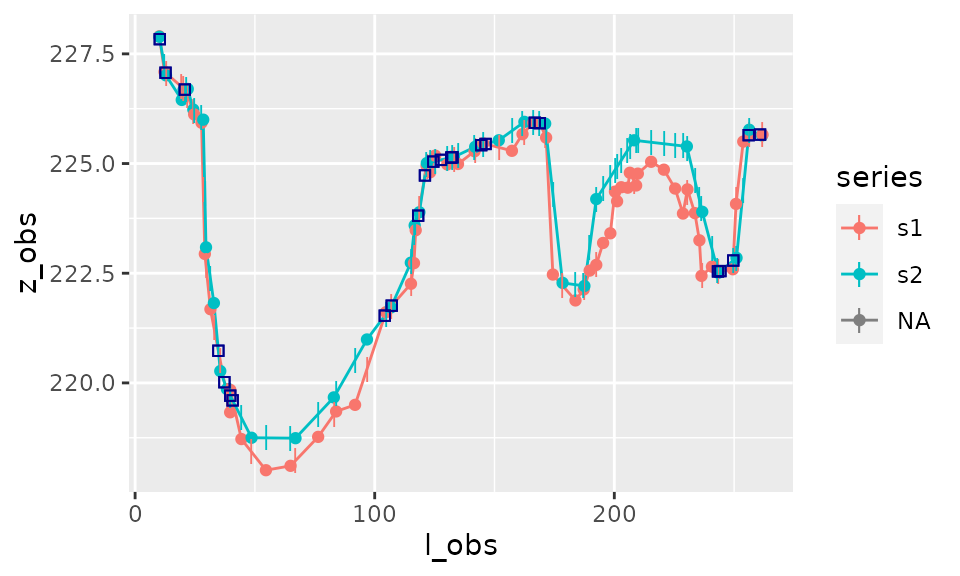
Principle of the area calculation
To calculate the area between the curves we need to interpolate the data and calculate intersects between the two curves:
Use of area_between()
This, as well as the calculation of corresponding trapezia, is realised by the function area_between().
result_area <- area_between(s1,s2)
result_area
#> $data
#> # A tibble: 237 x 13
#>        l    z1 p          z2        a type  l_obs z_obs series  zmin  zmax  lmin
#>    <dbl> <dbl> <chr>   <dbl>    <dbl> <fct> <dbl> <dbl> <chr>  <dbl> <dbl> <dbl>
#>  1  10.1  228. observ…  228.  0       <NA>   10.1  228. s1        NA    NA    NA
#>  2  10.1  228. observ…  228.  8.68e-4 upper  10.1  228. s2        NA    NA    NA
#>  3  10.3  228. inters…  228. NA       upper  NA     NA  <NA>      NA    NA    NA
#>  4  10.3  228. inters…  228. -1.13e-1 lower  NA     NA  <NA>      NA    NA    NA
#>  5  12.3  227. observ…  227.  0       <NA>   12.3  227. s1        NA    NA    NA
#>  6  12.3  227. interp…  227. -2.40e-2 lower  NA     NA  s2        NA    NA    NA
#>  7  12.7  227. inters…  227. NA       lower  NA     NA  <NA>      NA    NA    NA
#>  8  12.7  227. inters…  227.  4.79e-3 upper  NA     NA  <NA>      NA    NA    NA
#>  9  12.9  227. interp…  227.  0       <NA>   NA     NA  s1        NA    NA    NA
#> 10  12.9  227. observ…  227.  1.14e+0 upper  12.9  227. s2        NA    NA    NA
#> # … with 227 more rows, and 1 more variable: lmax <dbl>
#>
#> $area
#> [1] -98.07248
#>
#> $area_by_type
#> # A tibble: 2 x 2
#>   type     area
#>   <fct>   <dbl>
#> 1 upper    7.76
#> 2 lower -106.
#>
#> $sigma_area
#> [1] 0
The output of the function corresponds to
- total area between curves (i.e. positive area - negative area)
- area between curves according to whether first curve is above the second curve (“upper”) or below (“lower”)
- data with all coordinates of interpolated points and intersects, used to calculate the area of trapezia (and which will be used by function
plot_area())
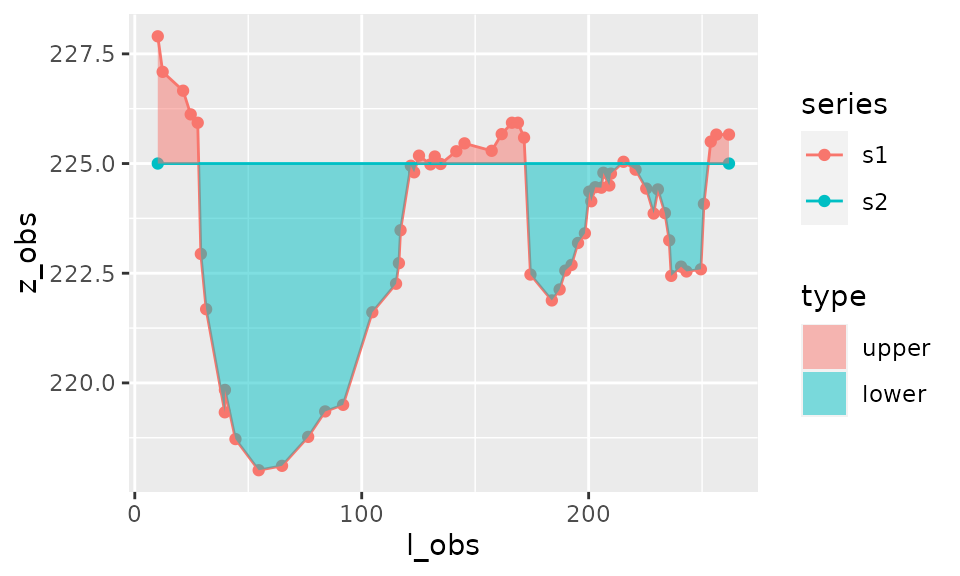
Note that it is also possible to calculate the area between one longitudinal series \(s_1=(l_1,z_1)\) and a constant horizontal value \(h\).
result_area_h <- area_between(s1,h=225)Plot of area
plot_area(result_area)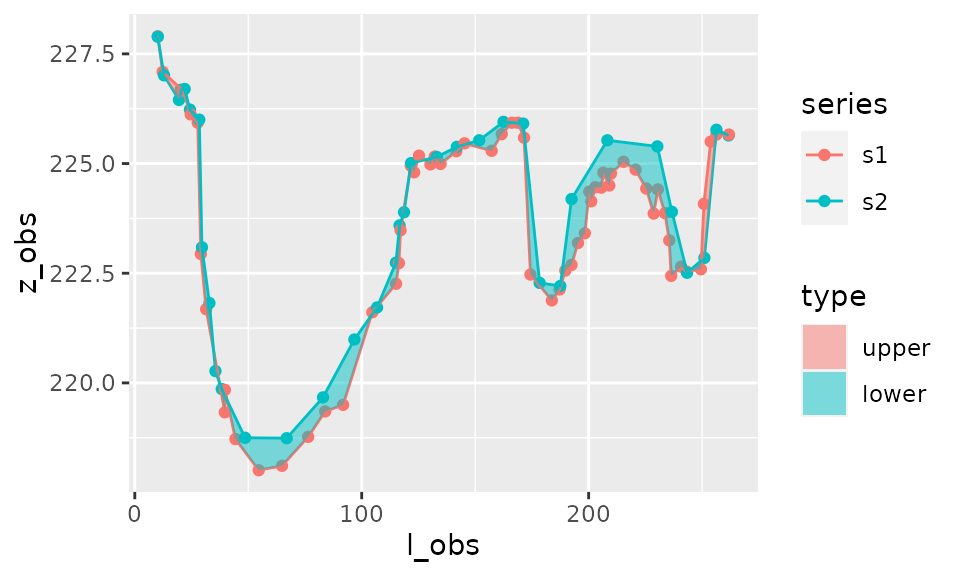
If the distinction between upper and lower area is irrelevant then it is possible not to distinguish these two types on the plot:
plot_area(result_area,distinguish_type=FALSE)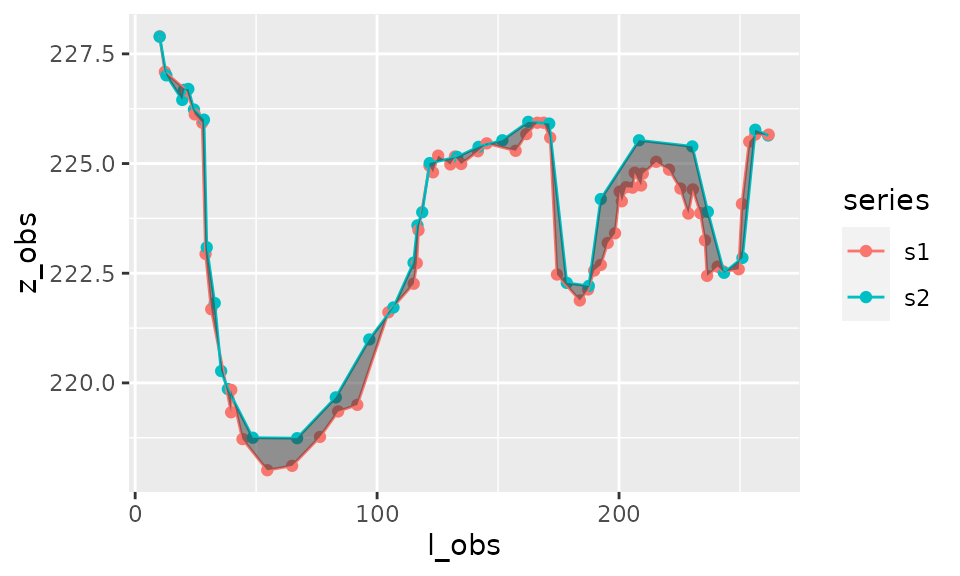
The plotting function plot_area() can also be used with just one series and constant horizontal level \(h\), as calculated earlier:
plot_area(result_area_h)