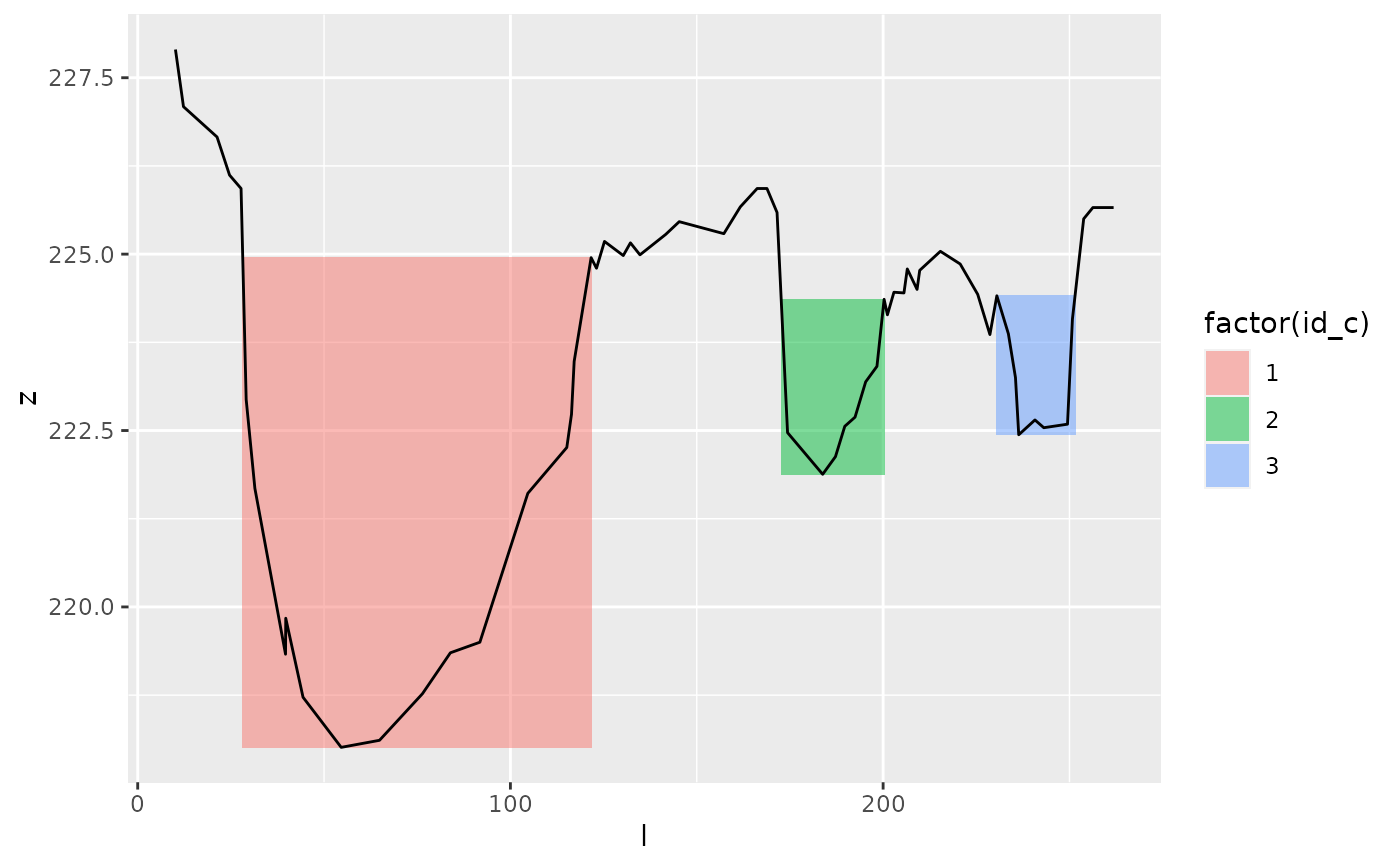
A function that plots channels and sections.
plot_channels.RdA function that plots channels and sections.
plot_channels(channels, sr)
Arguments
| channels | a table with channels and sections coordinates, as returned by get_channels |
|---|---|
| sr | tibble with columns l and z describing profile |
Value
a plot
