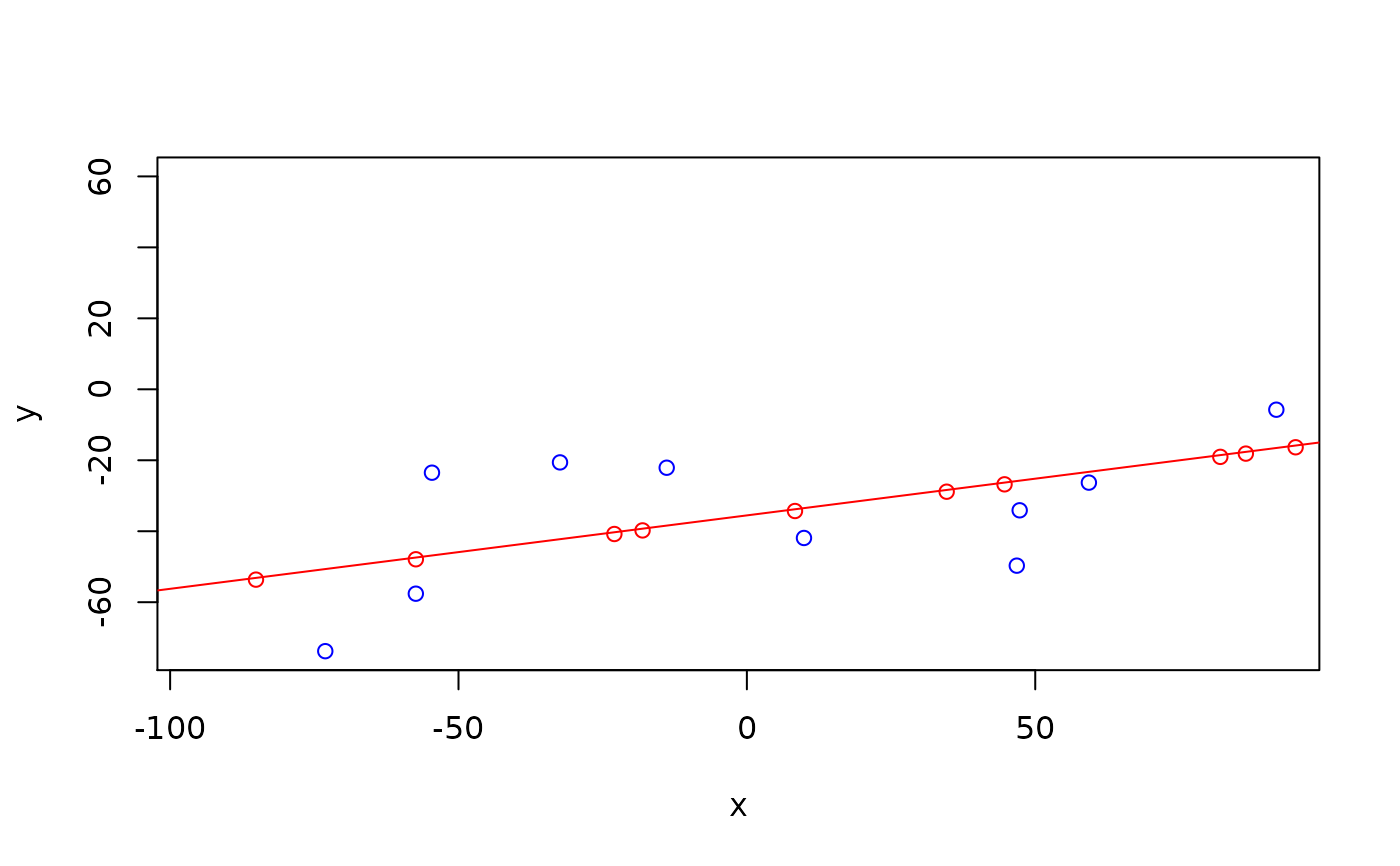
A function to project data on a bestfitting transect line
project_on_transect.RdA function to project data on a bestfitting transect line
project_on_transect(x, y)
Arguments
| x | x coordinate of points |
|---|---|
| y | y coordinate of points |
Value
xp x coordinate of points projected on the transect
yp y coordinate of points projected on the transect
xt x coordinate along the transect (new coordinate x)
yt y coordinate corresponding to the distance to the transect (new coordinate y)
slopexy slope of transect
interceptxy intercept of transect
Examples
x=c(-73.1,-57.4,-54.6,-32.4,-13.9, 9.9, 46.8, 59.3, 91.8, 47.3) y=c(-73.8,-57.6,-23.5,-20.6,-22.1,-41.9,-49.7,-26.3,-5.75,-34.1) res=project_on_transect(x,y) plot(x,y,col="blue", xlim=range(c(x,res$xt)), ylim=range(c(y,res$yt)))
