if (!require("tidyverse", quietly = TRUE))
    install.packages("tidyverse")
if (!require("lubridate", quietly = TRUE))
    install.packages("lubridate")
library(tidyverse)
library(lubridate)
df <- read_tsv('http://nxn.se/single-cell-studies/data.tsv',
               show_col_types = F) %>%
  mutate(Date = ymd(Date)) %>%
filter(Measurement == "RNA-seq")single-cell RNA sequencing analysis
Introduction
The goal of single-cell transcriptomics is to measure the transcriptional states of large numbers of cells simultaneously. The input to a single-cell RNA sequencing (scRNAseq) method is a collection of cells. Formally, the desired output is a transcript or genes (\(M\)) x cells (\(N\)) matrix \(X^{N \times M}\) that describes, for each cell, the abundance of its constituent transcripts or genes. More generally, single-cell genomics methods seek to measure not just transcriptional state, but other modalities in cells, e.g., protein abundances, epigenetic states, cellular morphology, etc.
Ideally, we want a scRNASeq method that:
- is universal in terms of cell size, type and state
- have no minimum input requirements (works on cells with low amount of RNA)
- assay every cell (100% capture rate)
- detect every transcript or gene in every cell (100% sensitivity)
- identify individual transcripts by their full-length sequence
- assign transcripts correctly to cells (no cell doublets)
The development of single-cell RNA-seq technologies and their adoption by biologists has been remarkable. Svensson et al. 2019 describes a database of articles which present single-cell RNA-seq experiments, and the graph below, rendered from the current version of the database, makes clear the exponential growth in single-cell transcriptomics:
df %>%
  arrange(desc(order(Date))) %>%
  group_by(Date) %>%
  summarise(number = n()) %>%
  mutate(cumulative_number = cumsum(number)) %>%
  ggplot() +
  geom_line(aes(x = Date, y = cumulative_number)) +
  labs(
    title = "Cumulative number of single-cell studies",
    y = "Cumulative number",
    x = "Date"
  ) +
  theme_classic()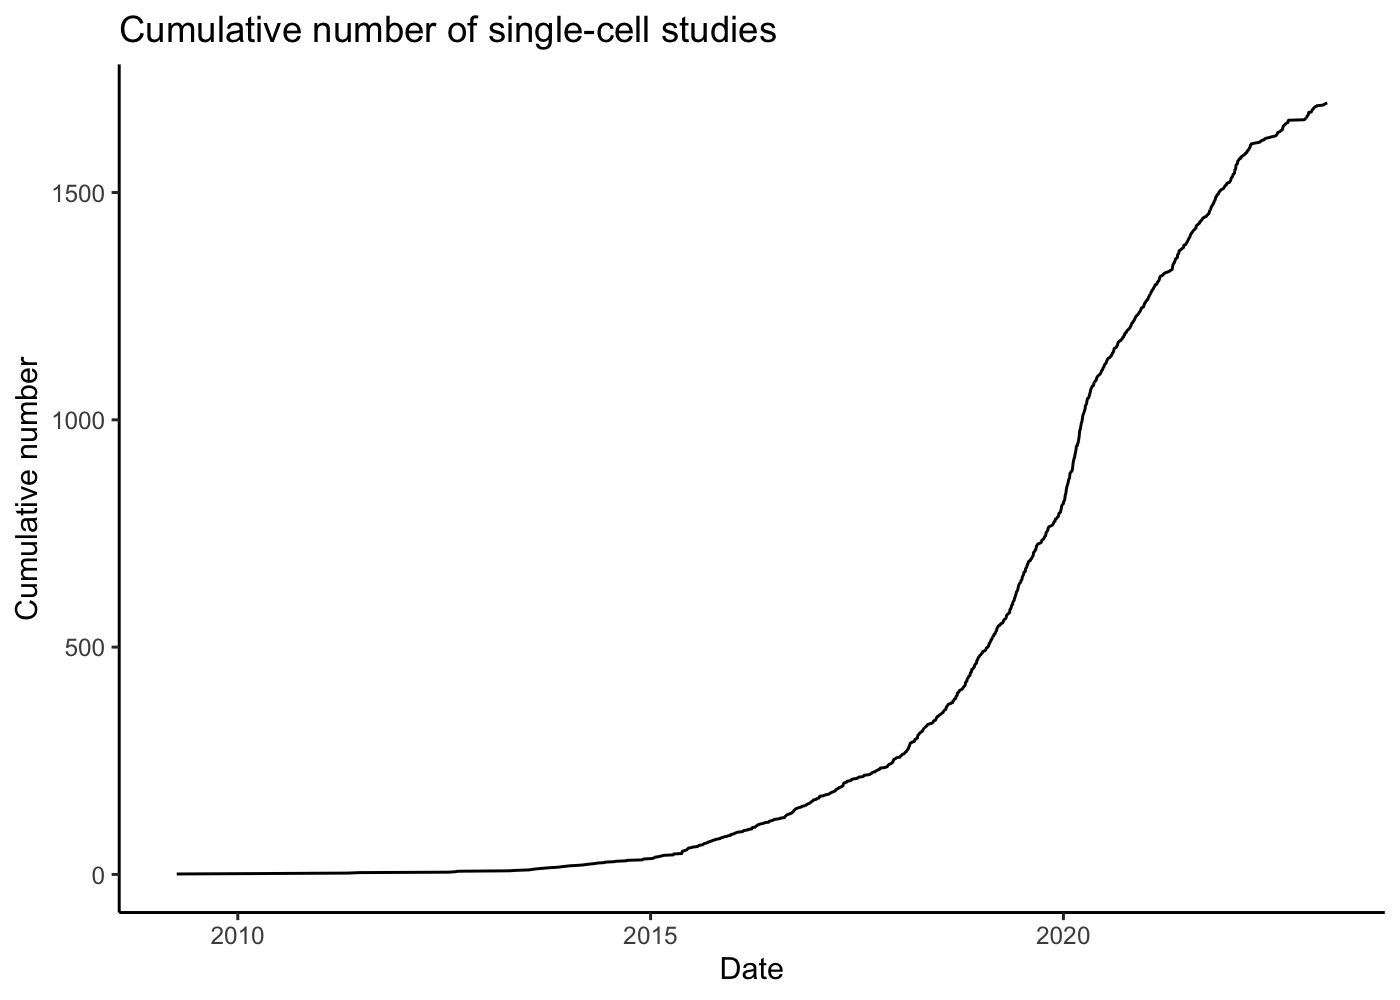
scRNASeq technologies
There are many different scRNAseq technologies in use and under development, but broadly they fall into a few categories
- well-based methods (e.g. Fluidigm SMARTer C1, Smart-seq2)
- droplet-based methods (e.g. Drop-seq, InDrops, 10X Genomics Chromium)
- spatial transcriptomics approaches (e.g. MERFISH, SEQFISH)
Improvement in these technologies has led to an increasing number of sequenced cells per experiments.
df %>%
  arrange(desc(order(Date))) %>%
  group_by(Date) %>%
  mutate(cell_number = mean(`Reported cells total`)) %>%
  ggplot() +
  geom_point(aes(x = Date, y = cell_number)) +
  labs(
    title = "Number of cells sequenced",
    y = "Cell number",
    x = "Date"
  ) +
  theme() +
  annotation_logticks() +
  scale_y_log10() +
  theme_classic()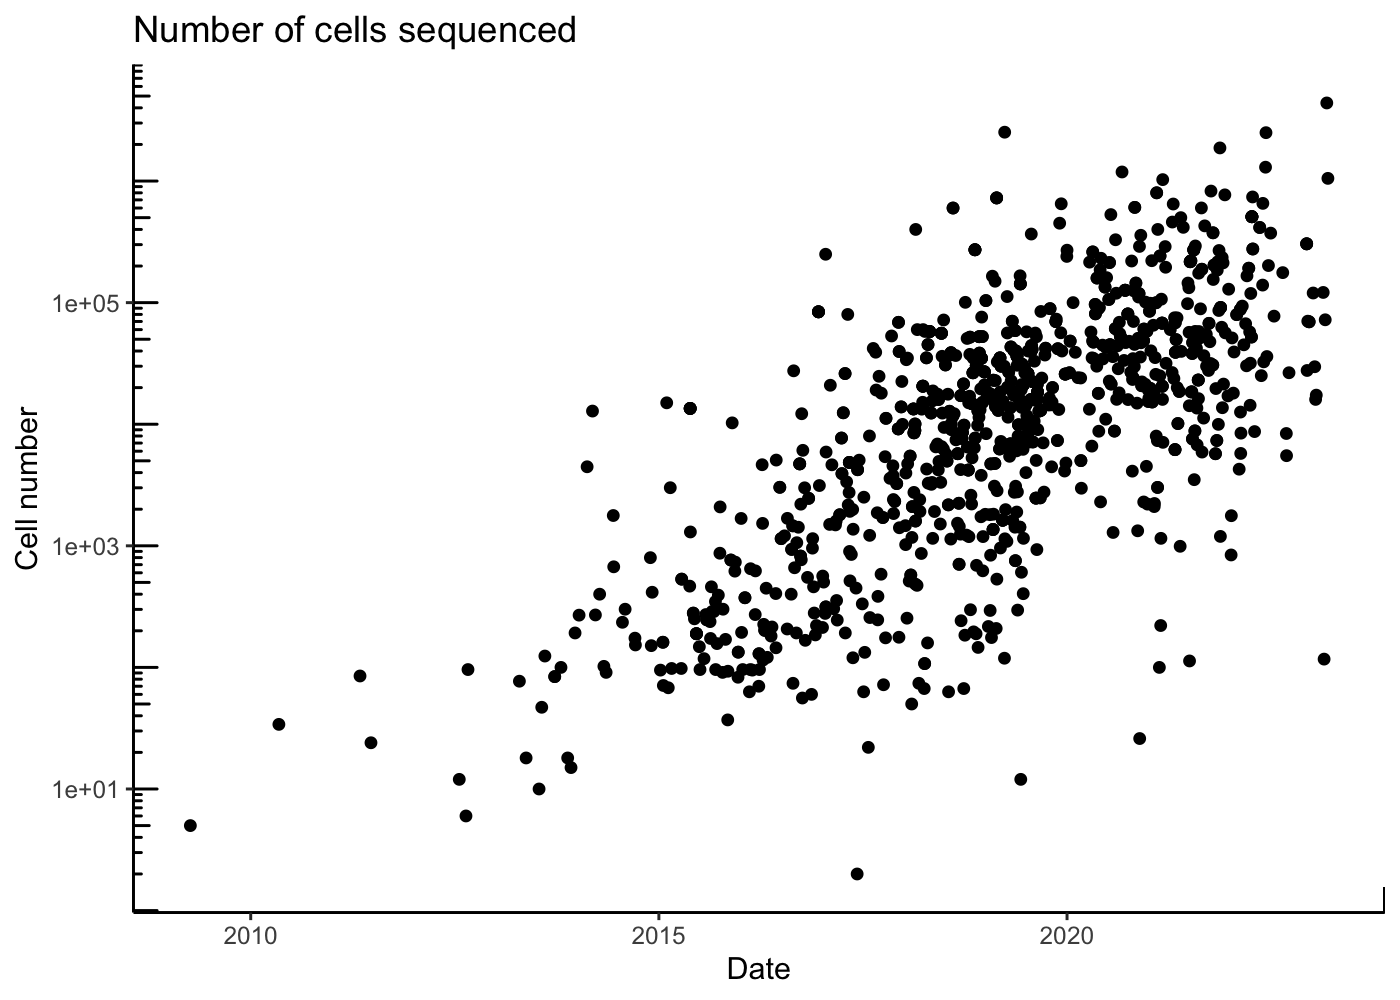
Droplet-based approaches have become popular due to their relative low-cost, easy to use, and scalability. This is evident in a breakdown of articles by technology used:
df %>%
  arrange(desc(order(Date))) %>%
  dplyr::select(Date, Technique) %>%
  separate_rows(Technique, sep = " & ") %>%
  mutate(Date = floor_date(Date, "2month")) %>%
  group_by(Date, Technique) %>%
  summarize(number = n(), .groups = "rowwise") %>%
  group_by(Technique) %>%
  mutate(tot_number = n()) %>%
  arrange(tot_number) %>%
  ungroup() %>%
  mutate(Technique = ifelse(tot_number < 20, "other", Technique),
         Technique = fct_reorder(Technique, tot_number, .desc = T)) %>%
  drop_na() %>%
  ggplot() +
  geom_col(aes(x = Date, y = number, fill = Technique)) +
  labs(
    title = "Technologie used in single-cell studies",
    y = "number of studies",
    x = "Date"
  ) +
  theme() +
  scale_y_log10() +
  annotation_logticks() +
  xlim(ymd("2013-01-01"), NA) +
  theme_classic()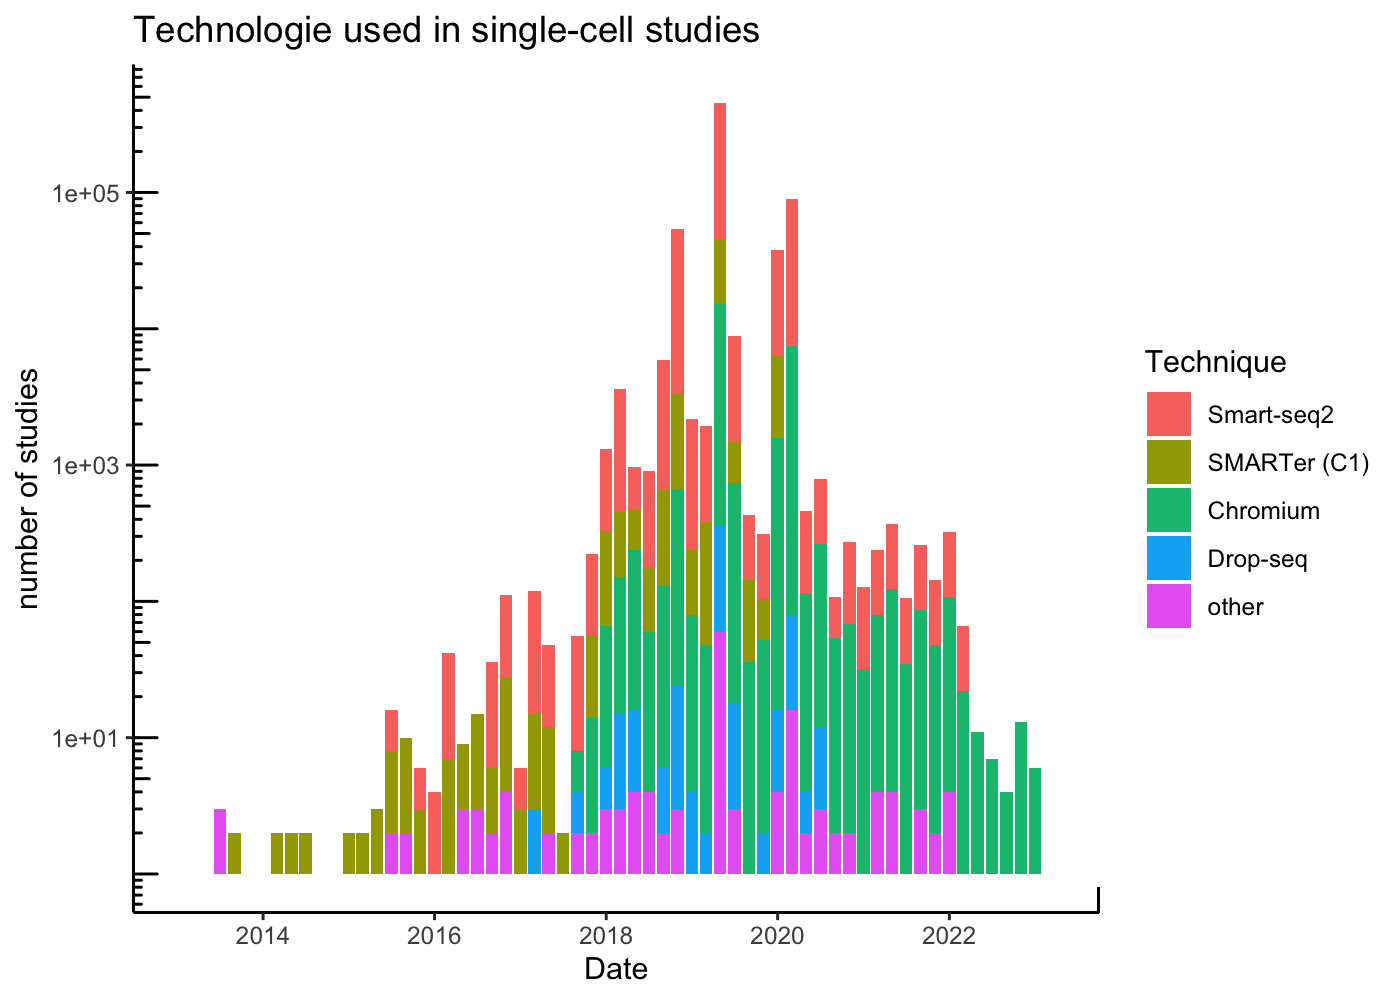
Droplet-based methods
Droplet based single-cell RNA-seq methods were popularized by a pair of papers published in 2015:
- Macosko et al., Highly parallel genome-wide expression profiling of individual cells using nanoliter droplets, 2015. DOI:10.1016/j.cell.2015.05.002 - describes Drop-seq.
- Klein et al., Droplet barcoding for single-cell transcriptomics applied to embryonic stem cells, 2015. DOI:10.1016/j.cell.2015.04.044 - describes inDrops.
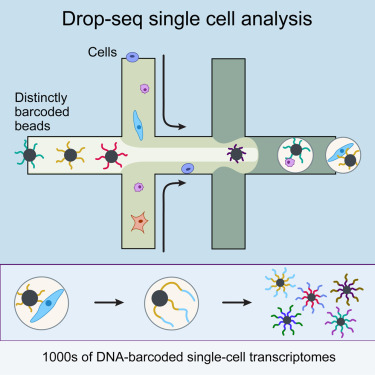
A microfluidic device is used to generate an emulsion, which consists of aqueous droplets in oil. The droplets are used to encapsulate cells, beads and reagents. In other words, each droplet is a “mini laboratory” in which the RNA from a single-cell can be captured and prepared for identification.
The generation of single-cell RNA-seq data is just the first step in understanding the transcriptomes cells. To interpret the data reads must be aligned or pseudoaligned, Unique Molecular Identifiers (UMIs) counted, and large cell x gene matrices examined. The growth in single-cell RNA-seq analysis tools for these tasks has been breathtaking. The graph below, plotted from real-time data downloaded from the scRNA-seq tools database, shows the number of tools published since 2016.
read_tsv("https://raw.githubusercontent.com/Oshlack/scRNA-tools/master/database/tools.tsv",
         show_col_types = F) %>%
  mutate(Date = ymd(Updated)) %>%
  arrange(desc(order(Date))) %>%
  group_by(Date) %>%
  summarise(number = n()) %>%
  mutate(cumulative_number = cumsum(number)) %>%
  ggplot() +
  geom_line(aes(x = Date, y = cumulative_number)) +
  labs(
    title = "Cumulative number of single-cell tools",
    y = "Cumulative number",
    x = "Date"
  ) +
  theme_classic()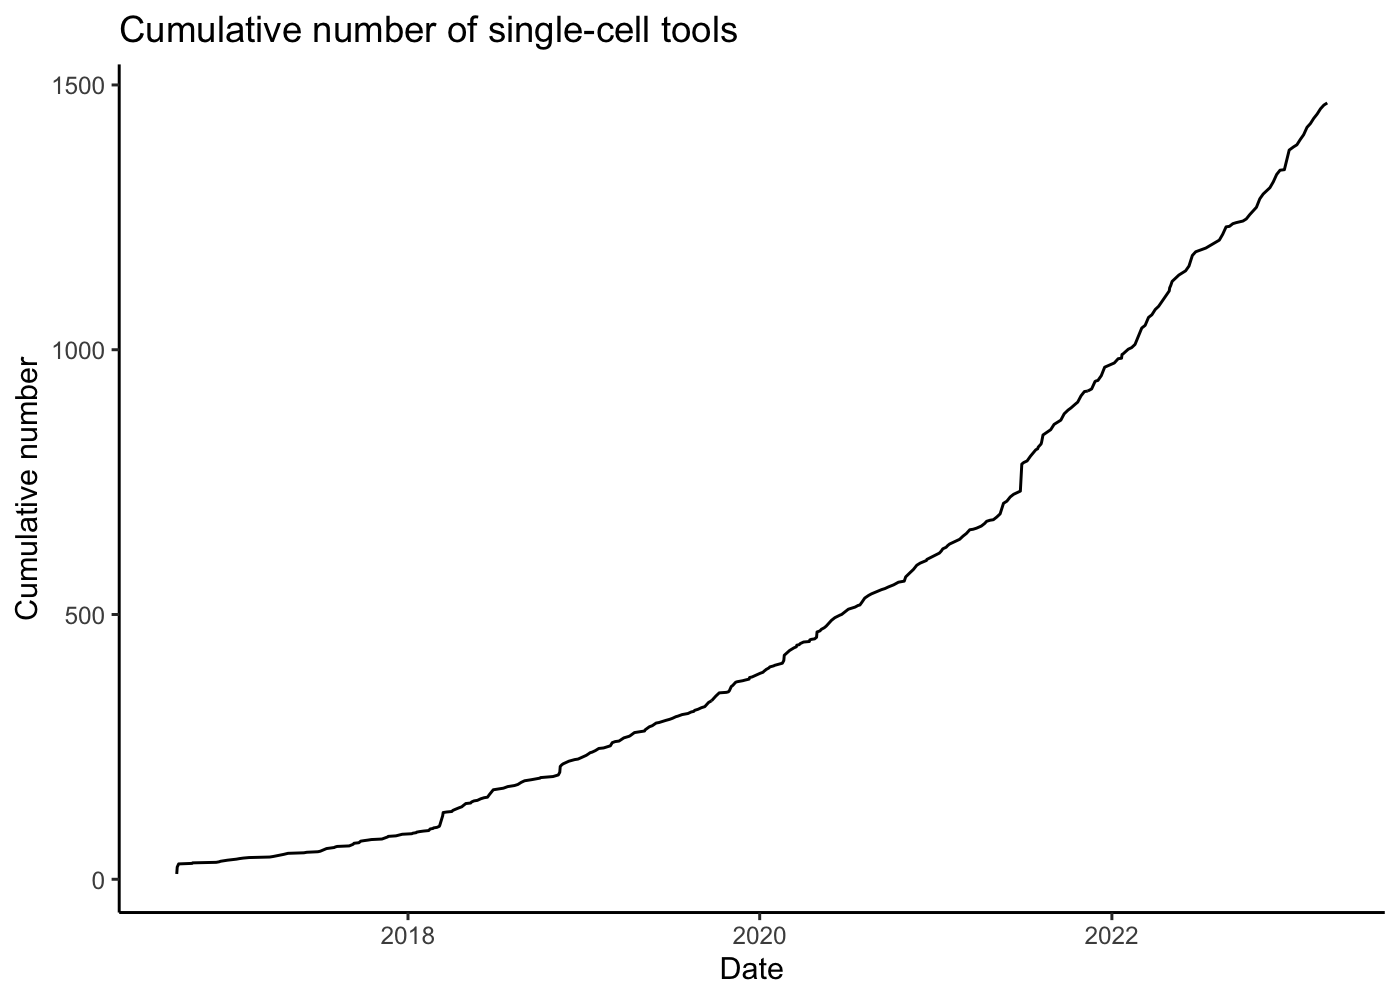
We are not going to learn how to use all these tools, but instead, focus on commonly used ones, to perform every steps of a single-cell RNASeq workflow.
In the following all quoted block like this one will correspond to things that you will have to do. Click on the Next link