# read counts (generate a sparse matrix)
res_mat <- BUSpaRse::read_count_output(
  dir = "results/hgmm_1k/genecount",
  name = "genes",
  tcc = FALSE)
dim(res_mat)

# build SingleCellExperiment (take 9GB of RAM without sparse matrix)
sce <- SingleCellExperiment(
      assays = list(
          counts = res_mat
      )
  )
counts(sce) %>% head()
rm(res_mat)scRNA-seq: single-cell experiment
Once we have our \(cell \times genes\) counts matrix, we want to import it in R for analysis.
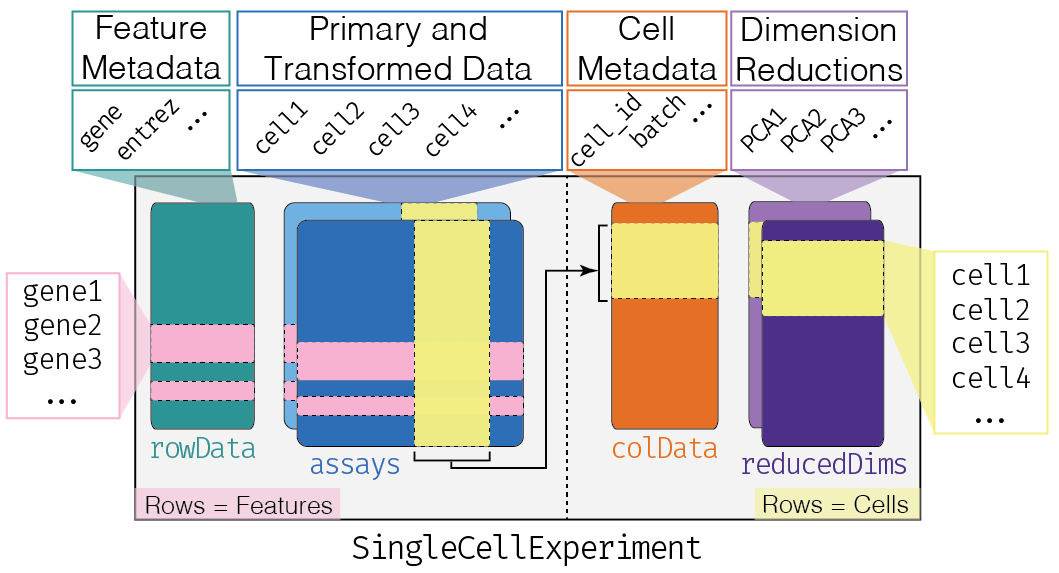
To store and manipulate our data in R, we are going to use the SingleCellExperiment class (from the SingleCellExperiment package). This class implements a data structure that stores all aspects of our single-cell data: gene-by-cell expression data, per-cell metadata and per-gene annotation and manipulate them in a synchronized manner.

This object is used by most of the single-cell package on Bioconductor.
Loading data
Single-cell RNA Seq counts contains a loot of zeros, to save space we can use the sparceMatrix object provided by the Matrix package.
You can use the read_count_output() function to load kb output into a sparceMatrix, and the SingleCellExperiment() to create a SingleCellExperiment object.
The number of genes is as expected for two species. There are way more cells than we expect, which is about 1000. So what’s going on?
Data Annotations
When we analyze genes, we want to record summary and information about them. The SingleCellExperiment has the rowData slot containing a DataFrame where each row corresponds to a gene and contains annotations like the transcript length or gene symbol.
From the tr2g table add the usual genes_-name information to your sce object. Then add a species column that tells us if a gene is from the Homo sapiens or the Mus musculs genome.
tr2g <- read_tsv("/data/share/MADT/TP_lmodolo/data/t2g.txt", col_names = c("transcript", "gene", "gene_name"))
rowData(sce) <- DataFrame(
  genes_id = rownames(sce),
  genes_names = tr2g$gene_name[match(rownames(sce), tr2g$gene)],
  species = ifelse(str_detect(rownames(sce), "^ENSMUSG"),
                        "Mus musculus", "Homo sapiens")
)
rowData(sce)

table(rowData(sce)$species %in% "Mus musculus")
We can also annotate genomic transcript from the Annotation Hub. You can use the AnnotationHub() and mapIds() function to extract the chromosomic positions of your transcripts.
hub_infos <- AnnotationHub()

hub_ids <- mcols(hub_infos) %>%
  data.frame() %>%
  rownames_to_column(var = "id") %>% # we keep the rownames
  as_tibble() %>%
  dplyr::filter(
    dataprovider %in% "Ensembl" & # Ensembl annotation
    species %in% c("Homo sapiens", "Mus musculus"), # for the two species we want
    genome %in% c("GRCh38", "GRCm38"), # on the right genome
    str_detect(title, "99"), # on the right revision
    rdataclass %in% "EnsDb",
  ) %>%
  dplyr::select(id, species)

pull_loc <- function(id, hub_infos){
  mapIds(
  hub_infos[[id]],
  keys = str_replace(rowData(sce)$genes_id, "(.*)\\..*", "\\1"),
  keytype = "GENEID",
  column = "SEQNAME")
}

merge_loc <- function(id, hub_infos){
  sapply(id %>% pull(id), pull_loc, hub_infos) %>%
    as_tibble() %>%
    unite(col = "chr_pos", na.rm = TRUE) %>%
    pull(chr_pos)
}

rowData(sce)$chr_pos = merge_loc(hub_ids, hub_infos)
rowData(sce)$is_genomic <- rowData(sce)$chr_pos %in% c(as.character(1:22), "X", "Y")
For cells-level information, we have the colData slot. We can use the gene_species to assign a species to a cell. If a given cell has more than 90% of it’s expressed genes annotated as Homo sapiens were going to annotate it as an Homo sapiens cell. We use the same rule for Mus musculus cells. The rest of the cells are annotated as mixed
dim(counts(sce))
colData(sce) <- DataFrame(
  n_mm_umi = colSums(counts(sce)[rowData(sce)$species %in% "Mus musculus", ]),
  n_hg_umi = colSums(counts(sce)[rowData(sce)$species %in% "Homo sapiens", ]),
  n_umi = colSums(counts(sce))
  )
colData(sce)$species <- colData(sce) %>%
  as_tibble() %>%
  mutate(
    prop_mm = n_mm_umi / n_umi,
    prop_hg = n_hg_umi / n_umi,
    species = case_when(
      prop_mm > 0.9 ~ "Mus musculus",
      prop_hg > 0.9 ~ "Homo sapiens",
      TRUE ~ "mixed"
    )
  ) %>% pull(species)
colData(sce)

colData(sce) %>%
  as_tibble() %>%
  summary()

# save(sce, file = "sce_singecellexperiment.Rdata")
Loots of cells have zeros counts…